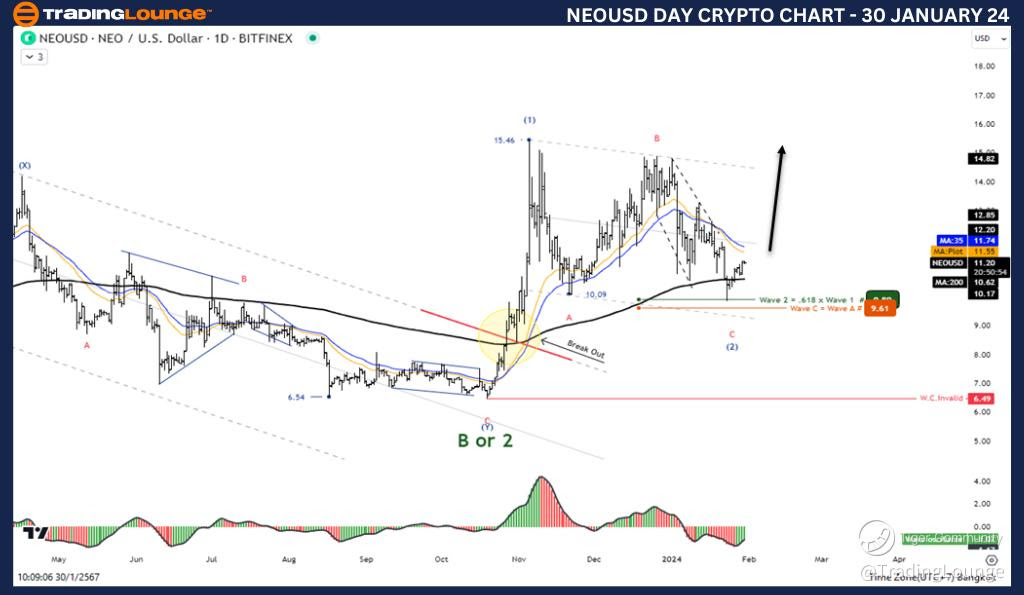
Elliott Wave Analysis TradingLounge Daily Chart, 30 January 24,
NEO / U.S. dollar(NEOUSD)
NEOUSD Elliott Wave Technical Analysis
Function: Counter Trend
Mode: Corrective
Structure: Flat
Position: Wave C
Direction Next higher Degrees: Wave (2) of Impulse
Wave Cancel invalid Level: 6.49
Details: Retracement of wave ((2)) usually .50 or .618 x Length wave ((1))
NEO / U.S. dollar(NEOUSD) Trading Strategy: The correction of wave(2) is likely to end at the 9.89 level and the five-wave increase. will help support this idea. So look for opportunities to open trades on the uptrend.
NEO / U.S. dollar(NEOUSD)Technical Indicators: The price is Above the MA200 indicating an uptrend, Wave Oscillators a bullish Momentum.
TradingLounge Analyst: Kittiampon Somboonsod, CEWA
Source: Tradinglounge.com, Learn From the Experts Join TradingLounge Here
PREVIOUS: Bitcoin/U.S. dollar(BTCUSD)
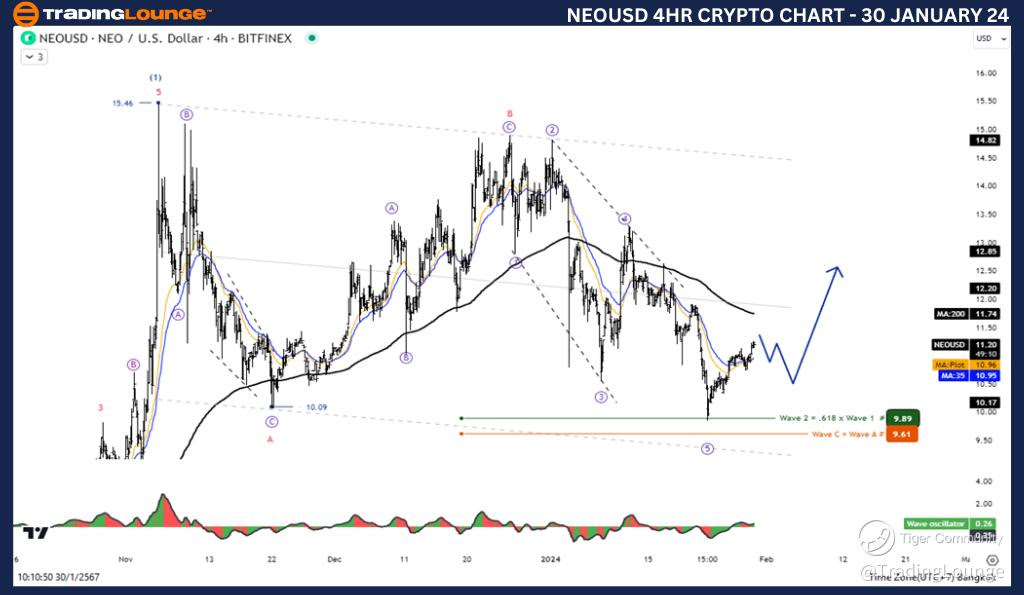
Elliott Wave Analysis TradingLounge 4Hr Chart, 30 January 24,
NEO / U.S. dollar(NEOUSD)
NEOUSD Elliott Wave Technical Analysis
Function: Counter Trend
Mode: Corrective
Structure: Double Corrective
Position: Wave (Y)
Direction Next higher Degrees: Wave ((2)) of Impulse
Wave Cancel invalid Level: 138.262
Details: Retracement of wave ((2)) usually .50 or .618 x Length wave ((1))
NEO / U.S. dollar(NEOUSD)Trading Strategy: The correction of wave(2) is likely to end at the 9.89 level and the five-wave increase. will help support this idea. So look for opportunities to open trades on the uptrend.
NEO / U.S. dollar(NEOUSD)Technical Indicators: The price is below the MA200 indicating a downtrend, Wave Oscillators a bearish Momentum.