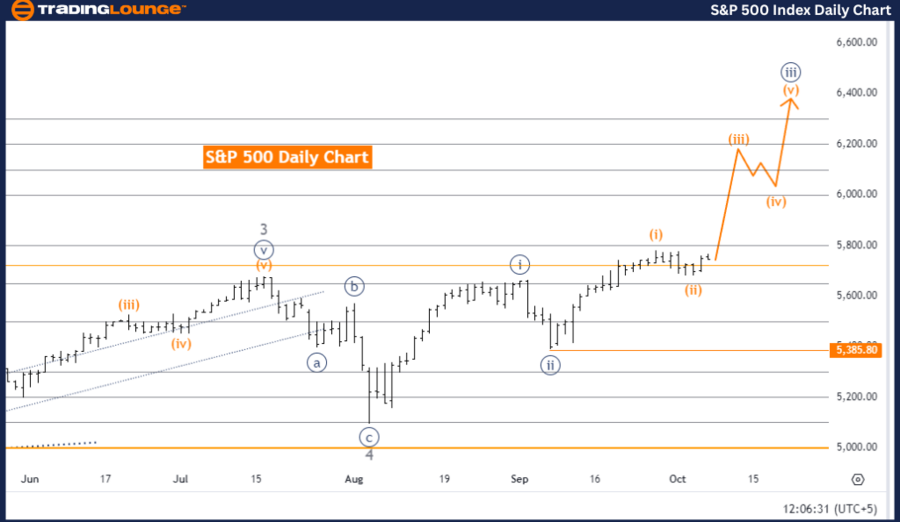
S&P 500 Elliott Wave Analysis Trading Lounge Day Chart
S&P 500 Elliott Wave Technical Analysis
Function: Trend
Mode: Impulsive
Structure: Orange Wave 3
Position: Navy Blue Wave 3
Next Lower Degree Direction: Orange Wave 4
Details: Orange wave 2 has completed, and orange wave 3 is now active.
Wave Invalidation Level: 5,385.80
The S&P 500 Elliott Wave Analysis for the daily chart shows a strong bullish trend with the market currently in an impulsive phase. The main wave structure is orange wave 3, which indicates upward momentum in alignment with the broader trend. Positioned within navy blue wave 3, this confirms a continuation of the impulsive movement on a larger scale.
The prior orange wave 2 correction has concluded, marking the transition to orange wave 3, typically the most powerful and prolonged phase in the Elliott Wave cycle. This wave phase suggests further price gains as the trend intensifies.
The next expected development is orange wave 4, which will begin once orange wave 3 peaks. Wave 4 generally represents a corrective phase, implying the market could pull back temporarily after the strength of wave 3. However, as of now, orange wave 3 remains in progress.
The invalidation level for this wave structure is set at 5,385.80. Should the price fall below this level, the current wave count would need to be reconsidered, as this drop would invalidate the existing wave structure. This level is crucial for confirming the continuation of the bullish trend.
Summary:
The S&P 500 Elliott Wave Analysis reflects a bullish trend, with orange wave 3 advancing after the completion of orange wave 2. The next phase is expected to be orange wave 4, which may lead to a temporary corrective movement. The critical invalidation level stands at 5,385.80, which serves as a pivotal point for confirming the ongoing trend.
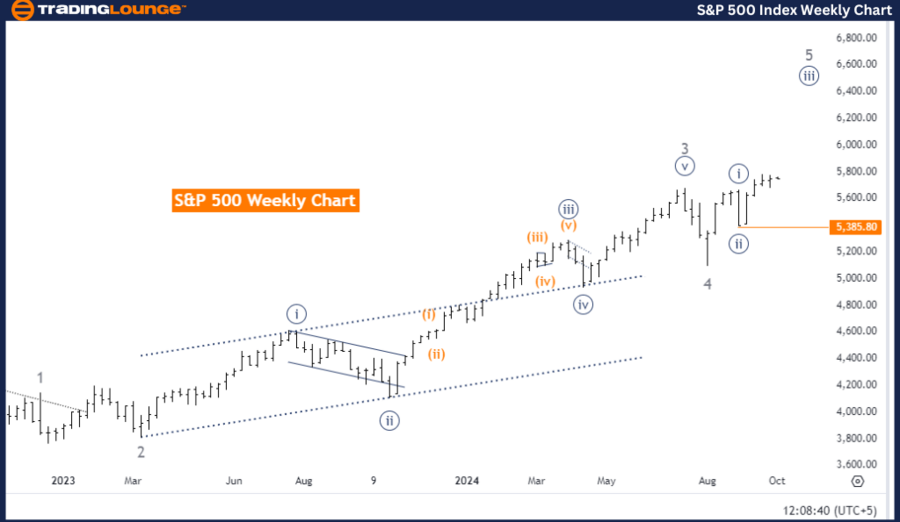
S&P 500 Elliott Wave Analysis Trading Lounge Weekly Chart
S&P 500 Elliott Wave Technical Analysis
Function: Trend
Mode: Impulsive
Structure: Navy Blue Wave 3
Position: Gray Wave 5
Next Lower Degree Direction: Navy Blue Wave 4
Details: Navy blue wave 2 has finished, and navy blue wave 3 is now active.
Wave Invalidation Level: 5,385.80
The S&P 500 Elliott Wave Analysis for the weekly chart reveals that the market is currently in a strong impulsive trend. The dominant wave structure is navy blue wave 3, indicating significant upward momentum within the larger trend. The current position within this structure is gray wave 5, reflecting the continuation of the broader impulsive pattern.
The corrective navy blue wave 2 has concluded, transitioning the market into navy blue wave 3, typically the most vigorous wave in the Elliott Wave cycle. This phase suggests continued market increases with strong bullish momentum.
Once navy blue wave 3 completes, the market is expected to shift into navy blue wave 4, which typically introduces a corrective phase within the broader wave pattern. However, at present, navy blue wave 3 remains dominant, showing continued upward market movement.
The invalidation level for this Elliott Wave structure is 5,385.80. A market drop below this level would invalidate the current wave count, requiring a new analysis of the market structure. This level is critical for verifying the ongoing trend.
Summary:
The S&P 500 Elliott Wave Analysis on the weekly chart shows a strong upward impulsive trend with navy blue wave 3 progressing after navy blue wave 2. The bullish movement is expected to continue until navy blue wave 3 completes, followed by a potential corrective phase in navy blue wave 4. The invalidation level is set at 5,385.80, a key point for confirming the wave structure.
Technical Analyst: Malik Awais
Source: visit Tradinglounge.com and learn From the Experts Join TradingLounge Here
Previous: FTSE 100 (UK) Elliott Wave Technical Analysis
VALUE Offer - Buy 1 Month & Get 3 Months!Click here
Access 7 Analysts Over 200 Markets Covered. Chat Room With Support