Silver (XAGUSD) Elliott Wave Analysis: A Comprehensive Forecast

Silver Elliott Wave Technical Analysis

Function: Trend

Mode: Trend

Structure: Impulse for (A)

Position: Wave 3 of (A)

Direction: Wave 4 of (A)

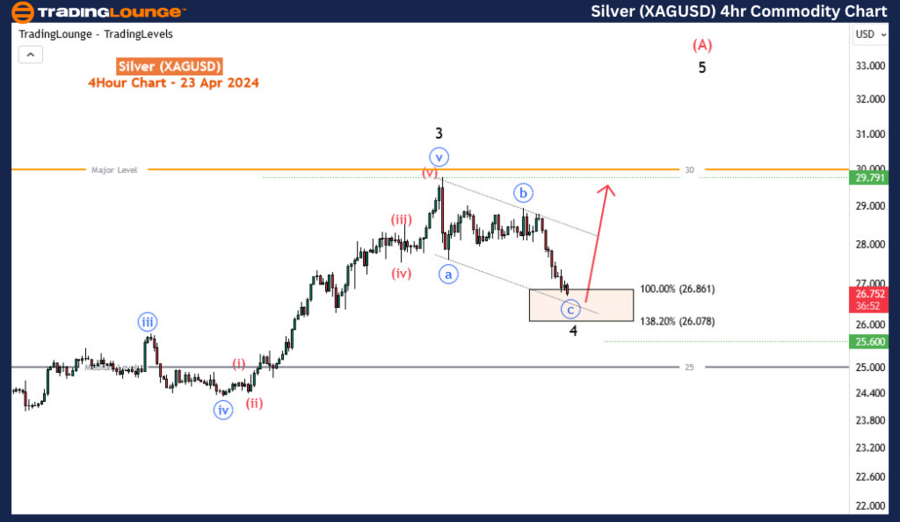
Details: Presently experiencing a wave 4 dip before further escalation into wave 5 of (A). Expect another leg lower for wave 4. Recent trends remain consistent.

Since April 12th, 2024, Silver has extended its pullback phase and currently sits within a critical Fibonacci reversal zone. This situation suggests a bullish continuation is on the horizon as the market prepares for an upward shift. During this period, investors are closely monitoring this area for signs of a bullish resurgence, emphasizing the importance for traders to focus on this key reversal zone.

Expert Predictions and Trading Insights with Daily Chart Analysis

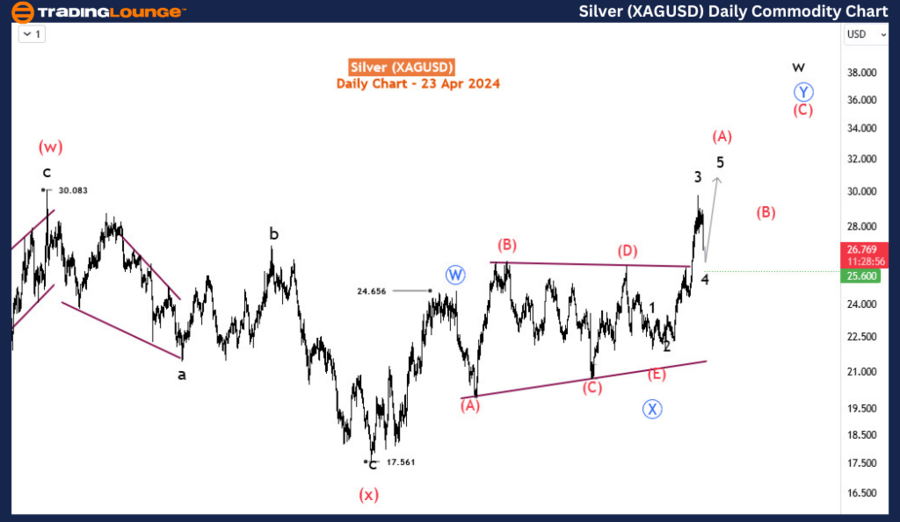
On the daily chart, Silver showcases a notable breakout from a long-term triangular pattern, part of a complex double zigzag structure originating from a low of $17.56 in September 2022. The price movement is currently progressing through the intermediate wave (A) of the primary wave Y, outlined in blue. Initiated in late January 2024, wave (A) is characteristically impulsive, indicating strong market movements. Within this impulsive sequence, the ongoing decline marks wave 4. As wave 4 nears its end, the market is setting the stage for a significant rise in wave 5, which could thrust the prices toward or beyond the $30 level. A critical aspect for traders is pinpointing the exact finish of wave 4.

Silver-XAGUSD-1D-Com...


Elliott Wave Technical Forecast for Silver 4-hour Chart Analysis

Turning our attention to the H4 chart, wave 4 appears as a zigzag pattern, pinpointing potential support at the 100-138% Fibonacci extension levels, between $26.86 and $26.07. If the price stretches to the 161.8% Fibonacci level at $25.6, it might challenge the zigzag formation’s stability, potentially leading to a sharper decline. Nevertheless, a rebound within this zone is anticipated, setting a crucial phase for the next bullish wave. Currently, prices are navigating this essential area, with the potential for further exploration of lower levels. However, a strong and decisive recovery from this point is essential for pushing into wave 5.

This analysis serves as a guide for traders and investors interested in Silver, providing insights into its near-term trajectories and long-term prospects within the framework of Elliott Wave theory. Understanding these patterns will help in making informed decisions in the commodities market, particularly for those trading in Silver.

Technical Analyst: Sanmi Adeagbo

Source: visit Tradinglounge.com and learn From the Experts Join TradingLounge Here 

See Previous: Natural Gas Elliottwave Analysis

TradingLounge's Free Week Extravaganza!

April 14 – 21: Unlock the Doors to Trading Excellence — Absolutely FREE

Silver-XAGUSD-4H-Com...

Related

Unlocking Elliott Wave Technical Analysis of Gold Commodity: A Comprehensive Guide to Price Trends and Investment Strategies

Unlocking Elliott Wave Technical Analysis of Gold Commodity: A Comprehensive Guide to Price Trends and Investment Strategies

This article offers an in-depth look at the gold commodity market, providing readers with a detailed...

Read More >
Exploring the Dynamics of the GX Uranium ETF (URA) through - Commodities Elliottwave Technical analysis

Exploring the Dynamics of the GX Uranium ETF (URA) through - Commodities Elliottwave Technical analysis

This comprehensive analysis of the GX Uranium ETF (URA) offers a deep dive into its performance thro...

Read More >
URW Elliott Wave Analysis for ASX Stock Unibail Rodamco Westfield Provides Critical Insights into Potential Stock Price Movements

URW Elliott Wave Analysis for ASX Stock Unibail Rodamco Westfield Provides Critical Insights into Potential Stock Price Movements

Our latest Elliott Wave analysis for ASX UNIBAIL-RODAMCO-WESTFIELD (URW) provides critical insights ...

Read More >
Hang Seng Index Elliott Wave Technical Analysis: Elliott Wave Insights for Daily and Weekly Market Trends

Hang Seng Index Elliott Wave Technical Analysis: Elliott Wave Insights for Daily and Weekly Market Trends

Gain in-depth insights into the Hang Seng Index through our Elliott Wave analysis of both daily and ...

Read More >
British Pound/U.S.Dollar (GBPUSD) Elliott Wave Technical Analysis 19 October 23

British Pound/U.S.Dollar (GBPUSD) Elliott Wave Technical Analysis 19 October 23

In summary, the GBPUSD Elliott Wave Analysis for 19 October 23, delivers valuable insights into the ...

Read More >

Buy 1 Month

Get 3 Months!

Special Offer:

Trade Recommendations

Unleash the power of deversified trading with our comprehensive portfolio, covering:

  • Stock Trades
  • Crypto Trades
  • Forex Trades
  • Commodity Trades
Elliott Wave Analysis

Gain a competive edge with expert insights in to:

  • Global Indices
  • US Stocks & ASX Stocks
  • Forex & Crypto
  • Commodities
Top-Notch Trading Tools

Equip yourself with the tools of success:

  • Social Chat
  • Elliott Wave Algorithm
  • Screener
  • TradingLevels
  • Trading Game
7 Elliott Wave Analysts

Stay ahead of the market with daily charts and insightful videos
-Your secret to strategic trading!

JOIN HERE


Welcome to TradingLounge (ASIC A.R.No. 321187), specialists in trades, trading education and technical analysis, covering stocks, indices, commodities, forex and cryptocurrencies.

When you join TradingLounge you have access to everything we offer, including trade tools, educational content and a social platform to chat with like-minded investors.

Read more

@Copyright 2024 by tradinglounge.com

Contact Us

Australian no: 02 4787 6020

International no: +61 (2) 47876020

Pay with:

Find us on