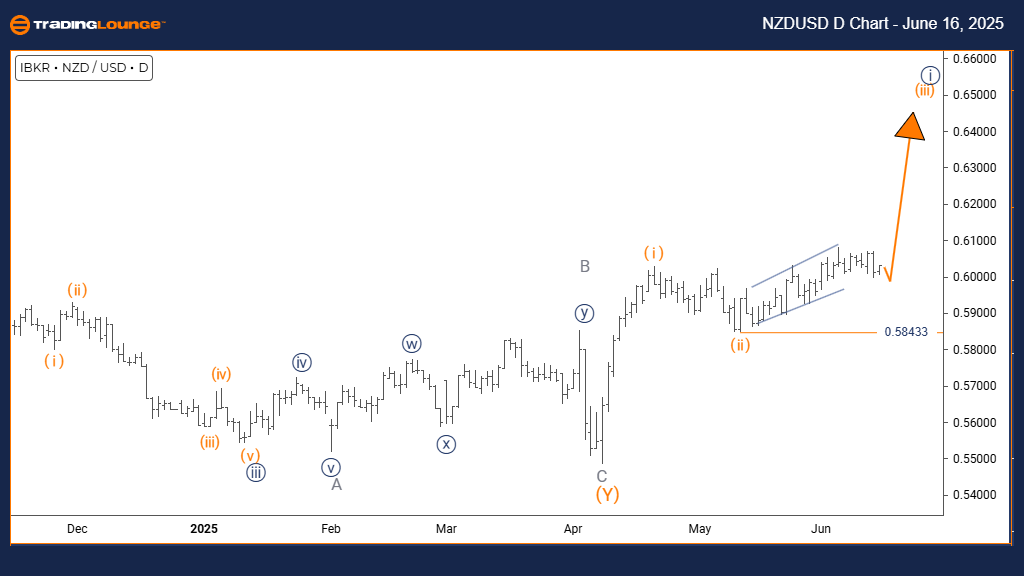
New Zealand Dollar / U.S. Dollar (NZDUSD) Elliott Wave Analysis | Trading Lounge Daily Chart
NZDUSD Elliott Wave Technical Analysis
FUNCTION: Bullish Trend
MODE: Impulsive
STRUCTURE: Orange Wave 3
POSITION: Navy Blue Wave 1
NEXT HIGHER DEGREE DIRECTION: Orange Wave 3 (active)
DETAILS: Completion of Orange Wave 2 observed; Orange Wave 3 is now developing.
INVALIDATION LEVEL: 0.58433
The Elliott Wave forecast for NZDUSD on the daily chart confirms a bullish trend structure. The current move is classified as an impulsive phase, falling within Orange Wave 3 under Navy Blue Wave 1, pointing to a continued upward trend in the medium term.
Following the apparent completion of Orange Wave 2, the onset of Orange Wave 3 has been detected. Historically, Wave 3 within an Elliott structure often yields the most extended and forceful price movement. This wave's initiation highlights the potential for ongoing bullish price action.
The critical invalidation level is set at 0.58433. Any decline below this threshold would invalidate the present wave count, calling for a re-evaluation. As long as the price remains above this line, the bullish Elliott structure is considered intact.
Overall, the chart analysis supports a strong upward movement. The impulsive nature of Orange Wave 3 suggests momentum is building, which aligns with a continued rise in NZDUSD.
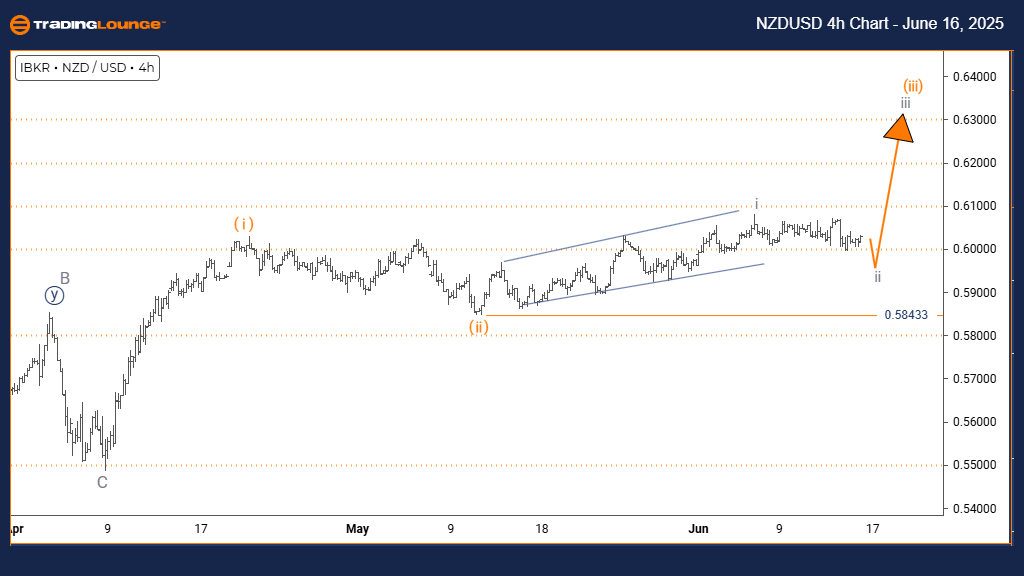
New Zealand Dollar / U.S. Dollar (NZDUSD) Elliott Wave Analysis | Trading Lounge 4-Hour Chart
NZDUSD Elliott Wave Technical Analysis
FUNCTION: Counter-Trend
MODE: Corrective
STRUCTURE: Gray Wave 2
POSITION: Orange Wave 3
NEXT HIGHER DEGREE DIRECTION: Gray Wave 3
DETAILS: Gray Wave 1 appears complete; Gray Wave 2 is currently forming.
INVALIDATION LEVEL: 0.58433
On the 4-hour chart, NZDUSD is undergoing a corrective pullback within a broader bullish framework. The current formation is identified as Gray Wave 2, developing inside the broader Orange Wave 3.
With Gray Wave 1 presumed complete, the focus shifts to the unfolding of Gray Wave 2. This phase represents a natural retracement before the projected continuation into Gray Wave 3, which would align with the larger upward trajectory.
The wave invalidation remains at 0.58433. A break beneath this level would challenge the existing count, demanding a new analysis. Presently, the structure continues to support a temporary correction inside a bullish trend.
Traders should monitor the progression of Gray Wave 2 closely. Its conclusion could pave the way for the next impulsive move in Gray Wave 3, reaffirming the bullish bias seen across higher time frames.
Technical Analyst: Malik Awais
Source: Visit Tradinglounge.com and learn from the Experts. Join TradingLounge Here
Previous: GBPAUD Elliott Wave Technical Analysis
VALUE Offer - $1 for 2 Weeks then $29 a month!Click here
Access 7 Analysts Over 200 Markets Covered. Chat Room With Support