13Jun

GBPAUD Elliott Wave Analysis: Daily Wave 2 Correction & 4‑Hour Wave B Retracement Ahead of Potential Forecasted Breakouts

British Pound / Australian Dollar (GBPAUD) Elliott Wave Analysis - Trading Lounge Day Chart

GBPAUD Elliott Wave Technical Analysis

FUNCTION: Counter Trend

MODE: Corrective

STRUCTURE: Navy blue wave 2

POSITION: Gray wave 3

DIRECTION NEXT HIGHER DEGREES: Navy blue wave 3

DETAILS: Navy blue wave 1 appears complete, triggering navy blue wave 2

The GBPAUD daily chart presents a classic Elliott Wave counter-trend pattern. This ongoing corrective phase—identified as navy blue wave 2—is unfolding within the broader framework of gray wave 3. It reflects a market retracement, not a continuation of the prevailing bullish or bearish momentum.

The chart confirms the end of navy blue wave 1, making way for the initiation of wave 2. This segment typically retraces part of the first wave's range, potentially forming the base for the upcoming navy blue wave 3 rally in the counter-trend direction.

Currently, GBPAUD price action remains subdued, displaying the horizontal consolidation often associated with wave 2 corrections. Technical traders should watch for patterns indicating wave 2 completion. A breakout would signal the emergence of wave 3, possibly bringing renewed directional momentum in the short to mid-term.

GBPAUD-Forex-Day-Cha...


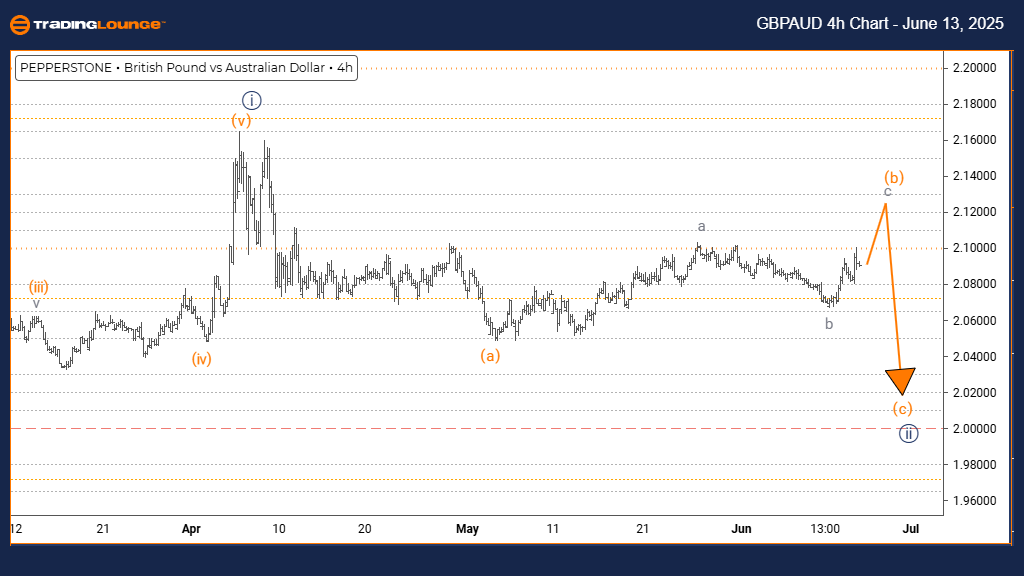
British Pound / Australian Dollar (GBPAUD) Elliott Wave Analysis - Trading Lounge 4-Hour Chart

GBPAUD Elliott Wave Technical Analysis

FUNCTION: Counter Trend

MODE: Corrective

STRUCTURE: Orange wave B

POSITION: Navy blue wave 2

DIRECTION NEXT LOWER DEGREES: Orange wave C

DETAILS: Orange wave A looks completed, with wave B currently active

On the GBPAUD 4-hour chart, a shorter-term Elliott Wave corrective structure is evident. The market is now within orange wave B, nested inside the larger navy blue wave 2 correction. This suggests ongoing price consolidation rather than a trending phase.

The shift from orange wave A to B indicates a retracement zone, typical during complex corrections. Orange wave B is expected to retrace a portion of wave A before transitioning into orange wave C. That would mark the next step in the unfolding counter-trend move.

The current technical scenario anticipates more choppy price action as wave B matures. Traders should focus on identifying signs of wave B’s end. This would likely set the stage for orange wave C, which may reintroduce a clearer trend direction in GBPAUD.

Technical Analyst: Malik Awais

Source: Visit Tradinglounge.com and learn from the Experts. Join TradingLounge Here

Previous: AUDUSD Elliott Wave Technical Analysis

VALUE Offer - $1 for 2 Weeks then $29 a month!Click here

Access 7 Analysts Over 200 Markets Covered. Chat Room With Support

GBPAUD-Forex-4h-Char...

Related

Ethereum Elliott Wave Technical Analysis Identifies ETHUSD Reversal Zone Using Fibonacci Levels and Trading Strategy

Ethereum Elliott Wave Technical Analysis Identifies ETHUSD Reversal Zone Using Fibonacci Levels and Trading Strategy

Ethereum Elliott Wave analysis shows wave C nearing completion, targeting the $1,230–$1,250 range. ...

Read More >
GBPUSD Elliott Wave Analysis: Forex Pair Bullish Trend, Key Levels & Expert Technical Analysis and Trend Forecasts for Traders

GBPUSD Elliott Wave Analysis: Forex Pair Bullish Trend, Key Levels & Expert Technical Analysis and Trend Forecasts for Traders

GBPUSD is in a bullish trend, currently forming an impulsive wave in the Elliott Wave structure. Key...

Read More >
National Australia Bank Limited Stock Analysis - NAB Elliott Wave Technical Forecast and Trading Strategies

National Australia Bank Limited Stock Analysis - NAB Elliott Wave Technical Forecast and Trading Strategies

This article provides an in-depth Elliott Wave analysis of NAB (National Australia Bank) stock on th...

Read More >
Latest KOSPI Composite Elliott Wave Analysis with Trading Strategies, Market Trends, Bullish Forecast, and Investing Insights

Latest KOSPI Composite Elliott Wave Analysis with Trading Strategies, Market Trends, Bullish Forecast, and Investing Insights

Get an updated Elliott Wave analysis for KOSPI Composite, including trading strategies, market trend...

Read More >
Australian Dollar/U.S.Dollar (AUDUSD) Elliott Wave Technical Analysis 20 November 23

Australian Dollar/U.S.Dollar (AUDUSD) Elliott Wave Technical Analysis 20 November 23

AUDUSD Elliott Wave Analysis Trading Lounge Day Chart dated 20 November 23, delves into a detailed e...

Read More >
Theta Token / U.S. dollar(THETAUSD) Elliott Wave Technical Analysis 14 November 23

Theta Token / U.S. dollar(THETAUSD) Elliott Wave Technical Analysis 14 November 23

Theta Token / U.S. dollar(THETAUSD) Elliott Wave Technical Analysis 14 November 23,

Read More >

$1 for 2 Weeks

then $29 a month!

What a Special Offer!

Trade Recommendations

Unleash the power of deversified trading with our comprehensive portfolio, covering 250+ markets:

  • Stock Trades
  • Crypto Trades
  • Forex Trades
  • Commodity Trades
Elliott Wave Analysis

Gain a competitive edge with expert insights and AI-powered Elliott Wave charting into:

  • Global Indices
  • US Stocks & ASX Stocks
  • Forex & Crypto
  • Commodities
Top-Notch Trading Tools

Equip yourself with the tools of success:

  • Real-time Chat rooms
  • Elliott Wave Algorithm
  • Portfolio tools
  • TradingLevels
  • Screener
  • Trading Game
7 Elliott Wave Analysts

Stay ahead of the market with daily charts and insightful videos
Your secret to strategic trading!

JOIN HERE


Welcome to TradingLounge (ASIC A.R.No. 321187), specialists in trades, trading education and technical analysis, covering stocks, indices, commodities, forex and cryptocurrencies.

When you join TradingLounge you have access to everything we offer, including trade tools, educational content and a social platform to chat with like-minded investors.

Read more

@Copyright 2024 by tradinglounge.com

Contact Us

Australian no: 02 4787 6020

International no: +61 (2) 47876020

Pay with:

Find us on