ASX: NATIONAL AUSTRALIA BANK LIMITED - NAB Elliott Wave Technical Analysis TradingLounge (1D Chart)
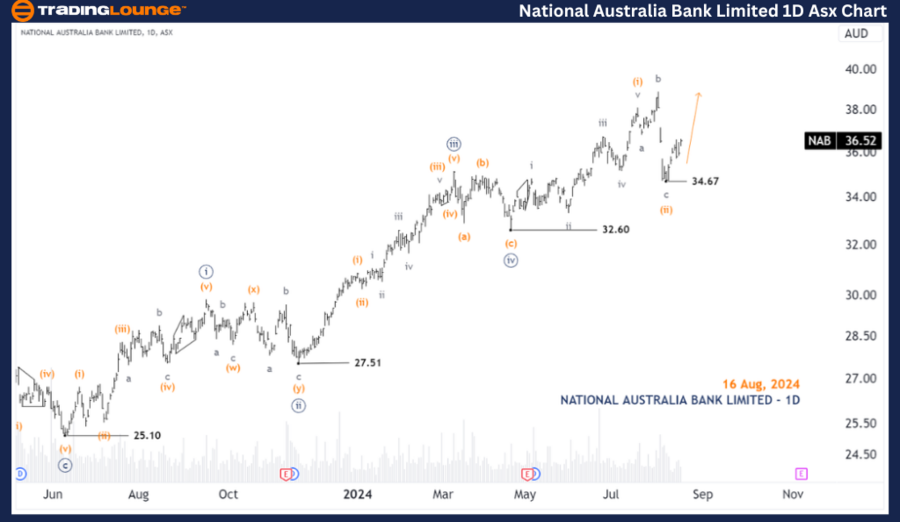
Introduction: In this Elliott Wave analysis, we examine the NATIONAL AUSTRALIA BANK LIMITED (NAB) listed on the Australian Stock Exchange (ASX). Our focus is on NAB.ASX as it appears poised to advance with wave (iii)-orange.
NAB Day Chart Analysis (Semilog Scale)
Function: Major Trend (Minute Degree, Navy)
Mode: Motive
Structure: Impulse
Position: Wave (iii)-Orange of Wave ((v))-Navy
Details: It appears that wave (ii)-orange has concluded as an Expanded Flat, and wave (iii)-orange is now unfolding with an upward momentum. To sustain this outlook, the price must stay above 34.67.
Invalidation Point: 34.67

ASX: NATIONAL AUSTRALIA BANK LIMITED Stock Analysis - (4-Hour Chart)
NAB Elliott Wave Technical Analysis
NAB 4-Hour Chart Analysis
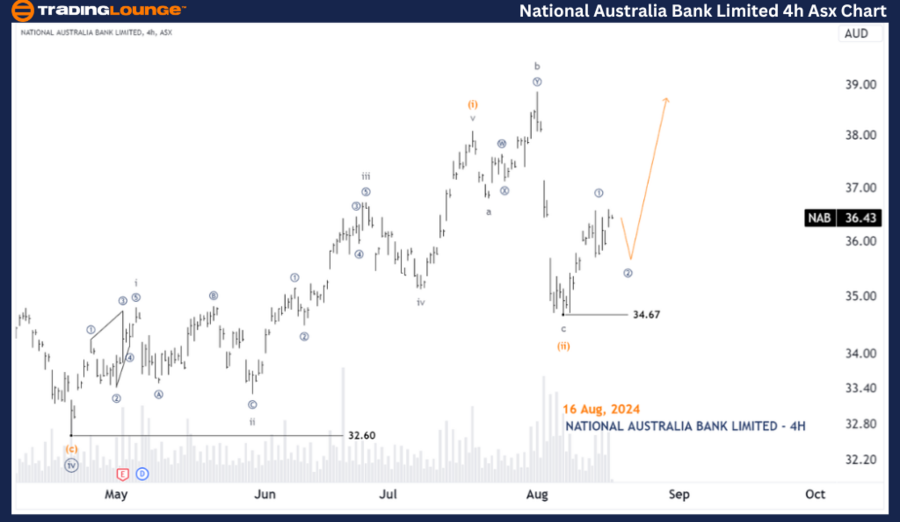
Function: Major Trend (Minuette Degree, Orange)
Mode: Motive
Structure: Impulse
Position: Wave ((2))-Navy of Wave (iii)-Orange
Details: The low at 34.67 marks the end of wave (ii)-orange, with wave (iii)-orange now emerging to move higher. This wave is subdividing into wave ((1))-navy, which has ended, and wave ((2))-navy, which is expected to push slightly lower before wave ((3))-navy drives the price upward.
Invalidation Point: 34.67
Conclusion:
Our Elliott Wave analysis on ASX: NATIONAL AUSTRALIA BANK LIMITED - NAB offers insights into the current market trends and actionable strategies for investors. We provide critical price levels that act as confirmation or invalidation signals, strengthening the accuracy of our wave counts. By integrating these key elements, we aim to deliver an objective and professional outlook on NAB’s market trajectory.
Technical Analyst: Hua (Shane) Cuong, CEWA-M (Master’s Designation).
Source: visit Tradinglounge.com and learn From the Experts Join TradingLounge Here
Previous: ASX LIMITED Elliott Wave Technical Analysis
Special Trial Offer - 0.76 Cents a Day for 3 Months! Click here
Access 7 Analysts Over 170 Markets Covered. Chat Room With Support
