06Jun

Spotify Technology S.A. (SPOT) U.S. Stocks Forecast Using Elliott Wave Analysis Predicts Bullish Upside to $800 With Daily Chart

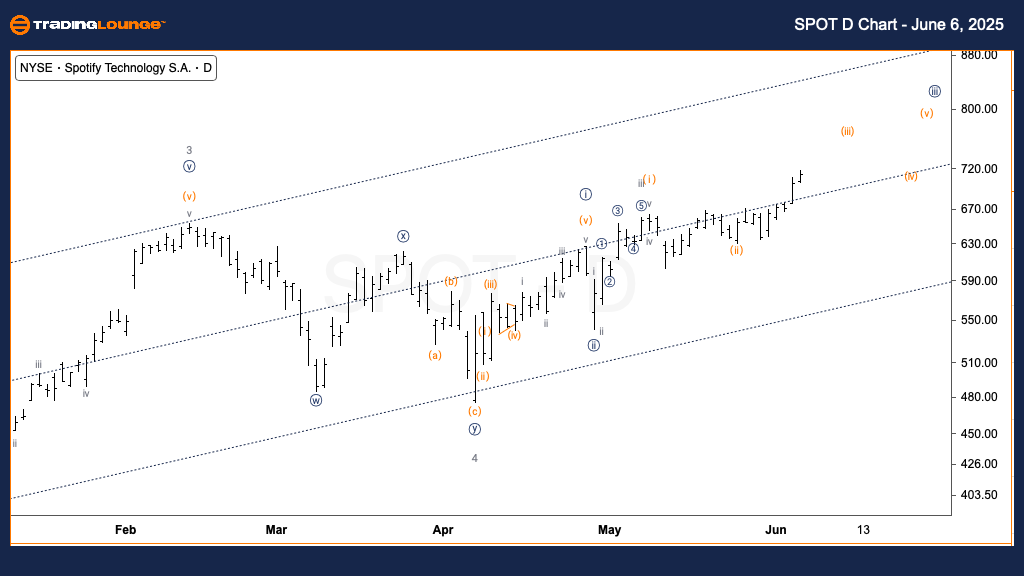
Spotify Technology S.A. (SPOT) Elliott Wave Analysis – TradingLounge Daily Chart

Spotify Technology S.A. (SPOT) Daily Chart Analysis Using Elliott Wave Theory

Spotify Technology S.A. (SPOT) Elliott Wave Technical Analysis

FUNCTION: Trend

MODE: Impulsive

STRUCTURE: Motive

POSITION: Wave (iii) of {iii}

DIRECTION: Upside in wave (iii)

DETAILS: Bullish outlook remains intact, with SPOT targeting the $800 level as wave (iii) progresses within the broader wave {iii} structure.

The daily chart for Spotify stock (SPOT) reveals a robust impulsive wave structure, now advancing in wave (iii) of a higher degree wave {iii}. According to Elliott Wave analysis, this phase typically shows accelerating momentum, confirming bullish sentiment. As long as price remains above key support levels, the SPOT stock forecast favors continued strength, potentially reaching the $800 zone. This aligns with classic motive wave behavior under Elliott Wave theory, validating sustained upside pressure.

SPOT-us-stock-day-ch...


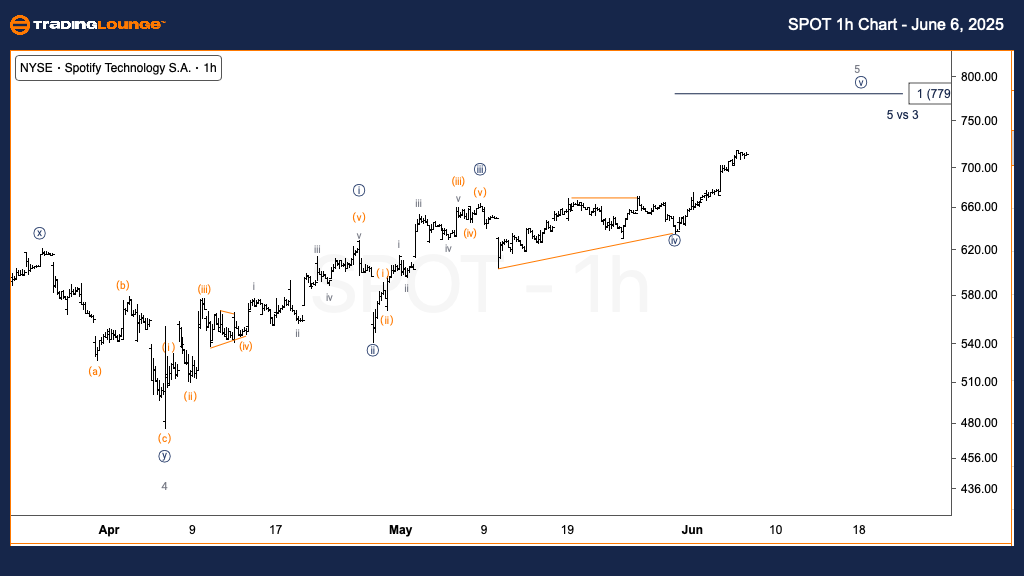
Spotify Technology S.A. (SPOT) U.S. Stock Analysis – TradingLounge 1-Hour Chart

Technical Analysis Using Elliott Wave Theory

FUNCTION: Trend

MODE: Impulsive

STRUCTURE: Motive

POSITION: Wave {v} of 5

DIRECTION: Upside in wave {v}

DETAILS: Conservative projection limits upside to $779 due to wave {iii} being shorter than wave {i}, signaling a potential high.

In the 1-hour chart view, Spotify stock continues to unfold in wave {v} of 5. Given that wave {iii} failed to extend beyond wave {i}, Elliott Wave guidelines suggest wave {v} could top near $779. This scenario implies reduced bullish strength in the short term and a probable reversal or corrective move thereafter. The SPOT technical outlook signals that traders should monitor for signs of exhaustion as the wave structure nears completion.

Technical Analyst: Alessio Barretta

Source: Visit Tradinglounge.com and learn from the Experts. Join TradingLounge Here 

Previous: Apple (AAPL) Elliott Wave Technical Analysis

VALUE Offer - Buy 1 Month & Get 3 Months!Click here

Access 7 Analysts Over 200 Markets Covered. Chat Room With Support

SPOT-us-stock-1h-cha...

Related

Elliott Wave Trading Strategies & Forecasts for S&P 500, NASDAQ 100, DAX 40, FTSE 100 & ASX 200

Elliott Wave Trading Strategies & Forecasts for S&P 500, NASDAQ 100, DAX 40, FTSE 100 & ASX 200

Stay ahead of the market with Elliott Wave insights across the S&P 500, NASDAQ 100, DAX 40, FTSE 100...

Read More >
Elliott Wave Analysis for Asian Paints Stock: Price Predictions and Forecast with Insights into the Stock's Possible Trajectory

Elliott Wave Analysis for Asian Paints Stock: Price Predictions and Forecast with Insights into the Stock's Possible Trajectory

This article provides an in-depth Elliott Wave analysis for Asian Paints stock, including key techni...

Read More >
AAVEUSD Elliott Wave Analysis & Price Prediction: Key Support Levels, Trading Strategies, and Market Trends

AAVEUSD Elliott Wave Analysis & Price Prediction: Key Support Levels, Trading Strategies, and Market Trends

AAVE Elliott Wave forecast, highlighting key price levels, trading strategies, and potential market ...

Read More >
LINKUSD Elliott Wave Analysis: Chainlink Price Forecast, Fibonacci Levels, Support and Resistance Insights for Crypto Traders

LINKUSD Elliott Wave Analysis: Chainlink Price Forecast, Fibonacci Levels, Support and Resistance Insights for Crypto Traders

LINK/USD Elliott Wave analysis to understand Chainlink's price movements and potential trends. E...

Read More >
Technical outlook on: WISETECH GLOBAL LIMITED – WTC Stock Analysis & Elliott Wave Technical Forecast

Technical outlook on: WISETECH GLOBAL LIMITED – WTC Stock Analysis & Elliott Wave Technical Forecast

This article provides an in-depth Elliott Wave analysis for WiseTech Global Limited (WTC) on the Aus...

Read More >
QUALCOMM Inc. (QCOM) Stocks Elliott Wave Technical Analysis Covers Insights from both the daily and 4-hour charts

QUALCOMM Inc. (QCOM) Stocks Elliott Wave Technical Analysis Covers Insights from both the daily and 4-hour charts

Explore our comprehensive Elliott Wave analysis for QUALCOMM Inc. (QCOM) as of June 12, 2024. This i...

Read More >

$1 for 2 Weeks

then $29 a month!

What a Special Offer!

Trade Recommendations

Unleash the power of deversified trading with our comprehensive portfolio, covering 250+ markets:

  • Stock Trades
  • Crypto Trades
  • Forex Trades
  • Commodity Trades
Elliott Wave Analysis

Gain a competitive edge with expert insights and AI-powered Elliott Wave charting into:

  • Global Indices
  • US Stocks & ASX Stocks
  • Forex & Crypto
  • Commodities
Top-Notch Trading Tools

Equip yourself with the tools of success:

  • Real-time Chat rooms
  • Elliott Wave Algorithm
  • Portfolio tools
  • TradingLevels
  • Screener
  • Trading Game
7 Elliott Wave Analysts

Stay ahead of the market with daily charts and insightful videos
Your secret to strategic trading!

JOIN HERE


Welcome to TradingLounge (ASIC A.R.No. 321187), specialists in trades, trading education and technical analysis, covering stocks, indices, commodities, forex and cryptocurrencies.

When you join TradingLounge you have access to everything we offer, including trade tools, educational content and a social platform to chat with like-minded investors.

Read more

@Copyright 2024 by tradinglounge.com

Contact Us

Australian no: 02 4787 6020

International no: +61 (2) 47876020

Pay with:

Find us on