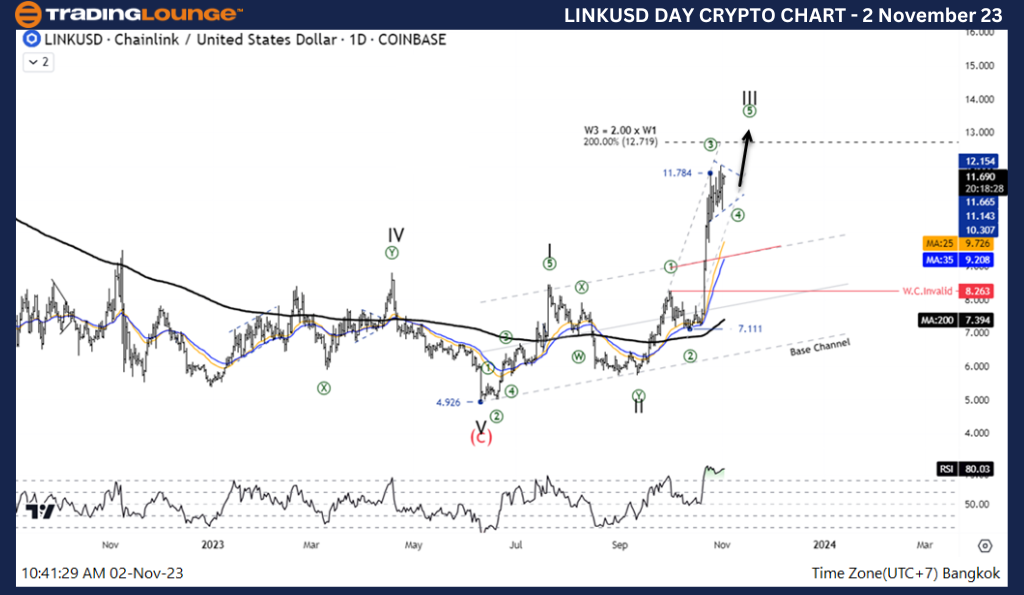
Elliott Wave Analysis TradingLounge Daily Chart, 2 November 23,
ChainLink / U.S. dollar(LINKUSD)
LINKUSD Elliott Wave Technical Analysis
Function: Follow Trend
Mode: Motive
Structure: Impulse
Position: Wave ((3))
Direction Next higher Degrees: Wave I of Impulse
Wave Cancel invalid Level: 8.259
Details: Wave 3 equal to 200.00% of Wave 1 at 12.719
ChainLink / U.S. dollar(LINKUSD)Trading Strategy: Third Wave Rise The internal sub-wave lacks one more surge in Wave 5, so we expect a surge above the 2.719 level.
ChainLink / U.S. dollar(LINKUSD)Technical Indicators: The price is above the MA200 indicating an uptrend, RSI is a Bullish Momentum.
TradingLounge Analyst: Kittiampon Somboonsod, CEWA
Source: Tradinglounge.com get trial here!

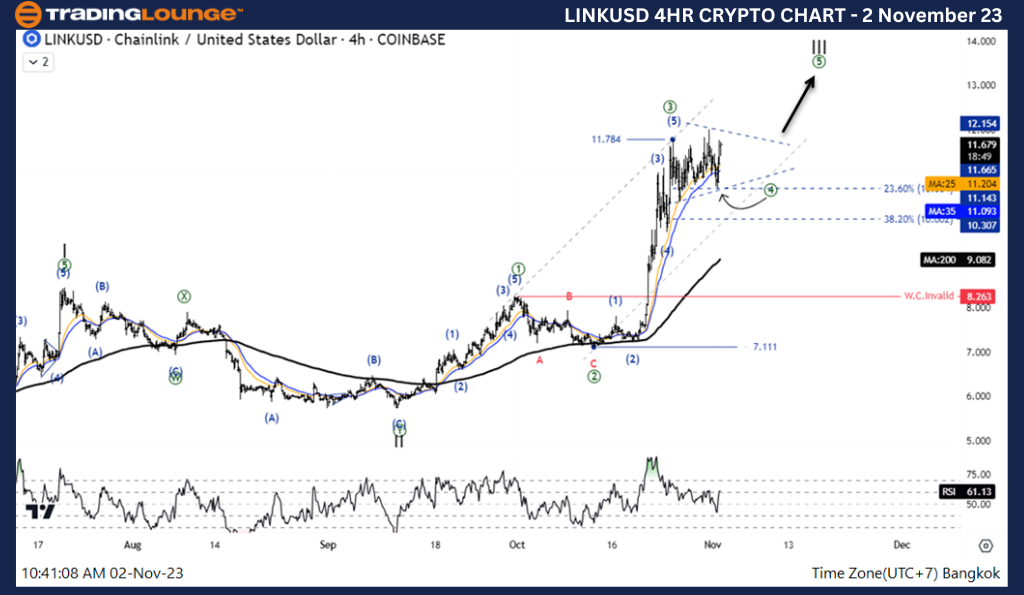
Elliott Wave Analysis TradingLounge 4H Chart, 2 November 23,
ChainLink / U.S. dollar(LINKUSD)
LINKUSD Elliott Wave Technical Analysis
Function: Counter Trend
Mode: Corrective
Structure: ….
Position: Wave (4)
Direction Next higher Degrees: Wave ((4)) of Impulse
Wave Cancel invalid Level: 8.236
Details: Retracement of wave ((4)) usually .382 x Length wave ((3))
ChainLink / U.S. dollar(LINKUSD)Trading Strategy: Third Wave Rise The internal sub-wave lacks one more surge in Wave 5, so we expect a surge above the 2.719 level.
ChainLink / U.S. dollar(LINKUSD)Technical Indicators: The price is above the MA200 indicating an uptrend, RSI is a Bullish Momentum.
