Elliott Wave Analysis TradingLounge Daily Chart, 21 February 24,
Elliott Wave analysts tracking Bitcoin's movements against the US dollar (BTCUSD) on February 21st, 2024, observe a compelling technical scenario that suggests a bullish sentiment may persist. Here's a breakdown of the Elliott Wave analysis for BTCUSD:
BTCUSD Elliott Wave Technical Analysis
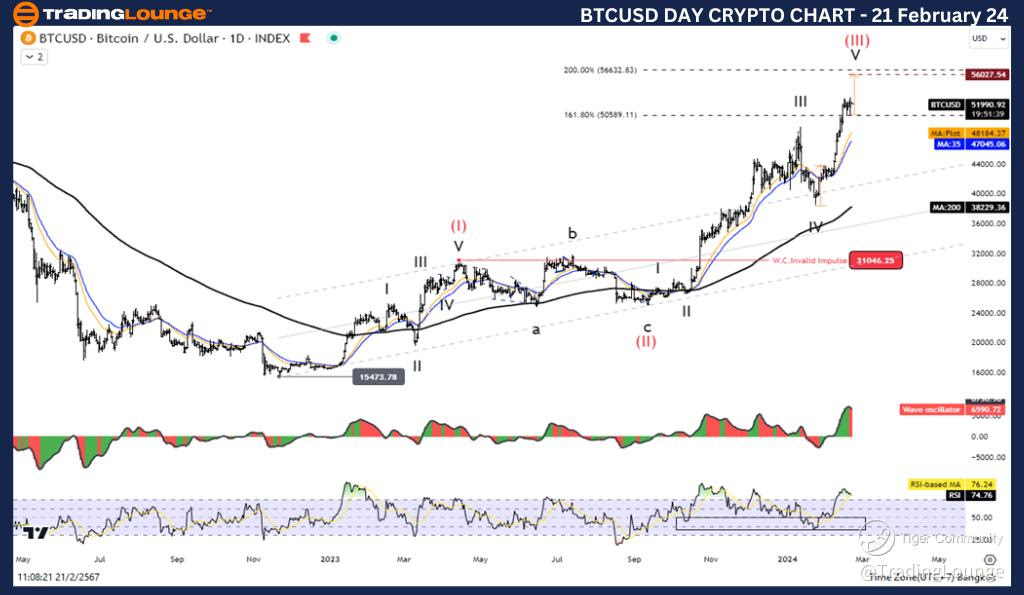
Daily Chart Analysis:
- Function: Following the Trend
- Mode: Motive
- Structure: Impulse
- Position: Wave V
- Direction Next Higher Degrees: Wave (III)
- Invalidation Level: 31046.25
On the daily chart, BTCUSD reveals a five-wave increase within Wave (III), indicating strong upward momentum. This wave sequence suggests a potential uptrend continuation. However, analysts caution that Wave (III) typically precedes a corrective Wave ((IV)). Traders are advised to remain vigilant for an impending correction following this significant uptick.
Technical indicators further support the bullish outlook, with the price comfortably positioned above the MA200, signaling an uptrend, while Wave Oscillators reflect bullish momentum.
TradingLounge Analyst: Kittiampon Somboonsod, CEWA
Elliott Wave Analysis TradingLounge 4Hr Chart, 21 February 24,
Bitcoin/ U.S. dollar(BTCUSD) Elliott Wave Technical Analysis
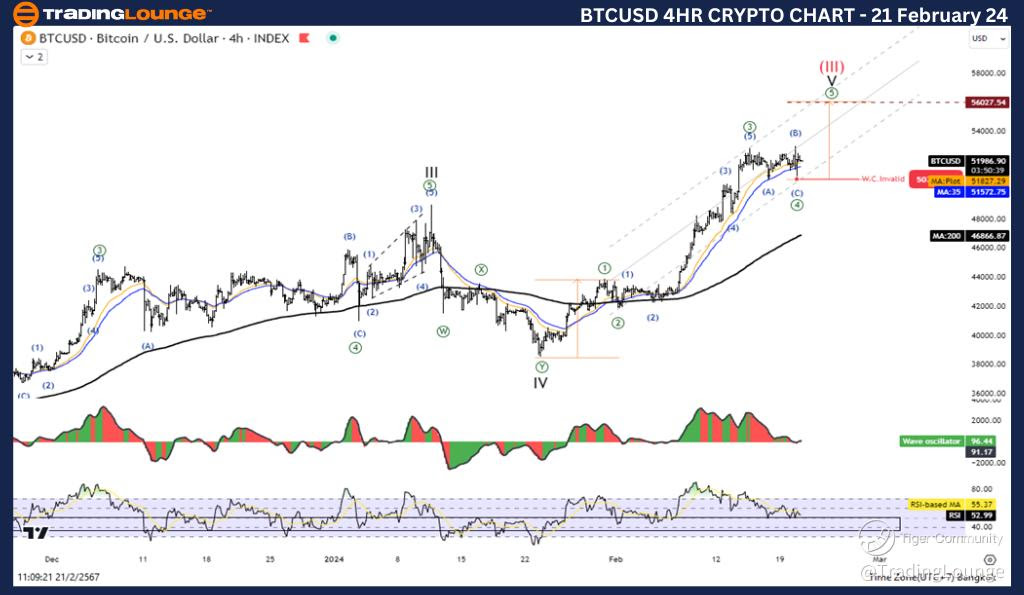
4-Hour Chart Analysis:
- Function: Following the Trend
- Mode: Motive
- Structure: Impulse
- Position: Wave V
- Direction Next Higher Degrees: Wave (III)
- Invalidation Level: 31046.25
A similar pattern emerges on the 4-hour chart, reinforcing the bullish narrative seen on the daily timeframe. The Elliott Wave analysis indicates a five-wave increase within Wave V, bolstering the case for continued upward movement in BTCUSD.
As with the daily chart, traders are advised to exercise caution as Wave (III) typically precedes a corrective Wave ((IV)). Vigilance is key to identifying potential entry and exit points amidst the market's dynamic shifts.
Once again, technical indicators align with the bullish sentiment, with the price maintaining its position above the MA200, indicative of an ongoing uptrend, while Wave Oscillators affirm bullish momentum.
TradingLounge Analyst: Kittiampon Somboonsod, CEWA
Source: visit Tradinglounge.com and learn From the Experts Join TradingLounge Here
See Previous: Theta Token/ U.S. dollar(THETAUSD)
Conclusion: In summary, Elliott Wave analysis of BTCUSD suggests a prevailing uptrend, with both daily and 4-hour charts displaying signals of bullish momentum. However, traders must remain mindful of potential corrective waves following the completion of Wave (III). By staying attuned to these patterns and technical indicators, traders can navigate the market with greater precision, capitalizing on opportunities while managing risk effectively.
For those engaging in BTCUSD trading, a comprehensive understanding of Elliott Wave principles coupled with strategic use of technical indicators can serve as valuable tools in optimizing trading decisions and maximizing profitability.