Exxon Mobil Inc. (XOM) Elliott Wave Analysis – Trading Lounge Daily Chart
XOM Elliott Wave Technical Analysis
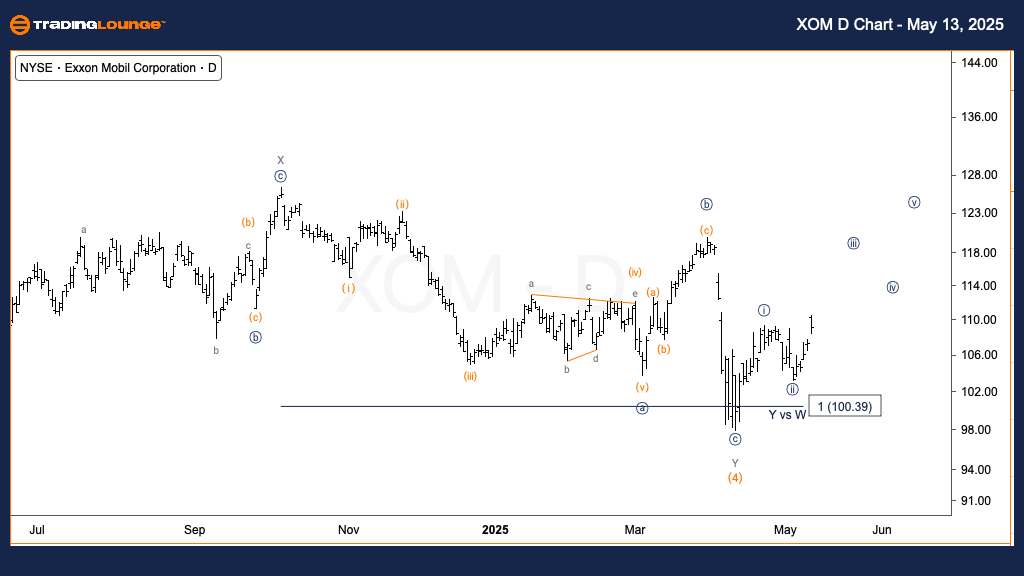
FUNCTION: Trend
MODE: Impulsive
STRUCTURE: Motive
POSITION: Wave {iii} of 1
DIRECTION: Upside in wave {iii}
DETAILS: Wave (4) has likely concluded, followed by a completed five-wave pattern in wave {i}, and a three-wave correction in wave {ii}.
Exxon Mobil (XOM) displays renewed bullish momentum on the daily chart, signaling the beginning of wave {iii}. The prior wave (4) appears finalized, making way for a motive five-wave rise in wave {i}, succeeded by a corrective move forming wave {ii}. Current price action suggests the onset of wave {iii}, often associated with sharp upward movement. This wave structure aligns with technical expectations for sustained price strength and further upside in the short to medium term.
Exxon Mobil Inc. (XOM) Elliott Wave Analysis – Trading Lounge 1H Chart
XOM Elliott Wave Technical Analysis
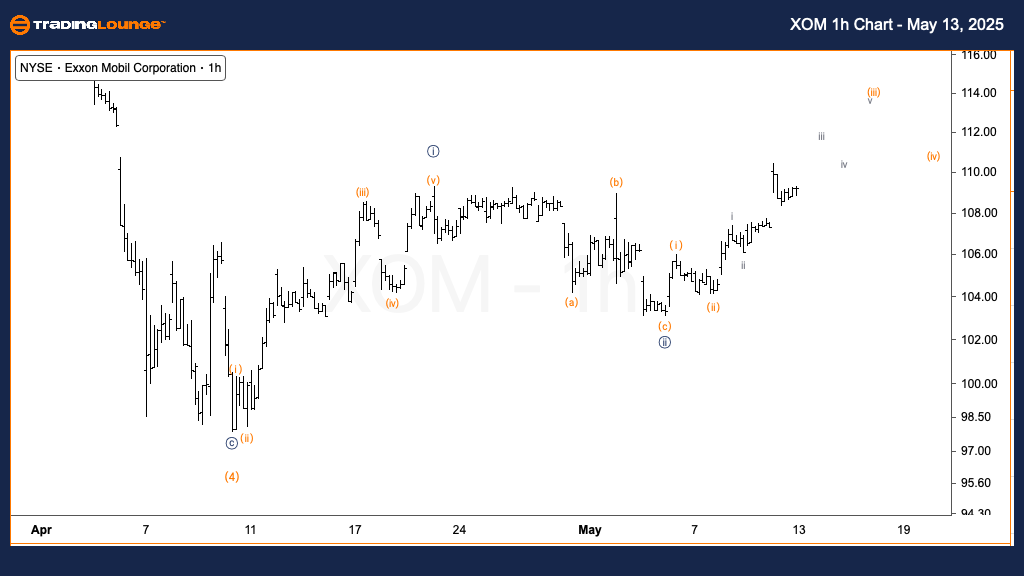
FUNCTION: Trend
MODE: Impulsive
STRUCTURE: Motive
POSITION: Wave (iii) of {iii}
DIRECTION: Upside in wave (iii)
DETAILS: The current price leg in wave (iii) is extending higher, highlighting momentum within minute wave {iii}.
On the 1-hour timeframe, Exxon Mobil (XOM) maintains a strong bullish trend within wave (iii) of minute wave {iii}. The structure presents classic impulsive behavior, affirming upward momentum and suggesting a continued breakout pattern. Price extension within this wave implies further bullish action, as traders look for confirmation through volume and breakout levels. Market participants should stay alert for trend continuation signals as part of this developing Elliott wave sequence.
Technical Analyst: Alessio Barretta
Source: Visit Tradinglounge.com and learn from the Experts. Join TradingLounge Here
Previous: Mastercard Inc. (MA) Elliott Wave Technical Analysis
VALUE Offer - Buy 1 Month & Get 3 Months!Click here
Access 7 Analysts Over 200 Markets Covered. Chat Room With Support