26Mar

Elliott Wave Forecast for ASX:SQ2 BLOCK INC Shows Bullish Potential After Expanded Flat Correction with Key Levels to Watch

ASX: BLOCK, INC (XYZ) Elliott Wave Technical Forecast

Greetings, Today’s Elliott Wave analysis from TradingLounge centers on BLOCK, INC – XYZ (ASX: SQ2), listed on the Australian Stock Exchange. Current chart patterns suggest the stock is nearing the final stage of an Expanded Flat correction, potentially setting up a bullish reversal opportunity.

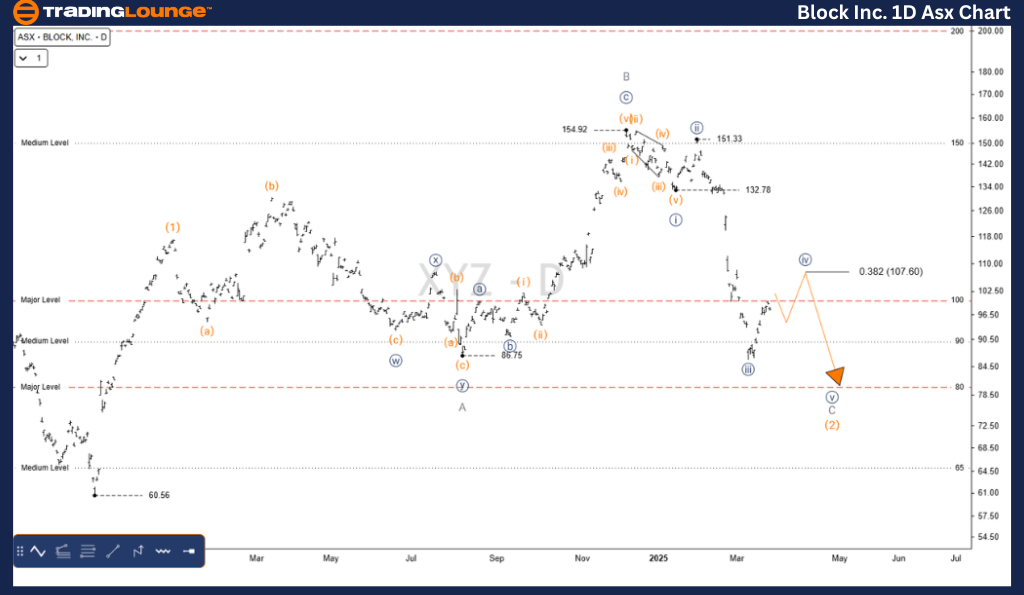
ASX: BLOCK, INC – XYZ  Elliott Wave Analysis (TradingLounge Daily Chart)

Chart Type: 1D (Semilog Scale)

Function: Major Trend (Intermediate Degree, Orange)

Mode: Motive

Structure: Impulse

Position: Wave C – grey of Wave (2) – orange

Analysis Summary:
Wave (2) – orange appears to be finalizing a complex Expanded Flat pattern. The last leg, identified as wave C – grey, needs one more downward push. Upon completion, wave (3) – orange may begin, suggesting a trend reversal with potential upside momentum.

Critical Invalidation Level: 60.56

BLOCK-INC-1D-Asx-Cha...


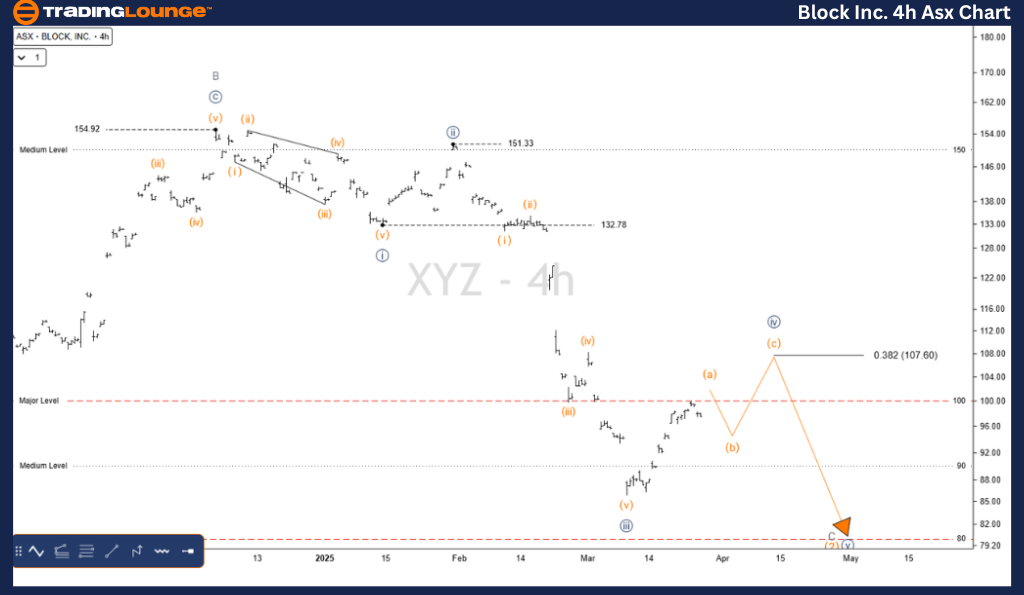
ASX: BLOCK, INC – XYZ Elliott Wave Outlook – TradingLounge (4-Hour Chart)

Chart Type: 4-Hour

Function: Major Trend (Minor Degree, Grey)

Mode: Motive

Structure: Impulse

Position: Wave ((iv)) – navy

Analysis Summary:

Wave C – grey unfolds within a typical five-wave impulse. Currently, wave ((iv)) – navy is advancing slightly higher. A final downward move with wave ((v)) – navy is expected next. If the price breaks cleanly above the 0.382 Fibonacci retracement, it could signal the early start of wave (3) – orange.

Key Fibonacci Level: 0.382

Critical Invalidation Level: 132.76

Technical Analyst: Hua (Shane) Cuong, CEWA-M (Master’s Designation).

Source: Visit Tradinglounge.com and learn from the Experts. Join TradingLounge Here 

See Previous: INSURANCE AUSTRALIA GROUP LIMITED Elliott Wave Technical Analysis

VALUE Offer - Buy 1 Month & Get 3 Months!Click here

Access 7 Analysts Over 200 Markets Covered. Chat Room With Support

BLOCK-INC-4h-Asx-Cha...


Conclusion:

This Elliott Wave breakdown for ASX: BLOCK, INC – XYZ (ASX:SQ2) provides both medium and short-term perspectives. Clearly defined invalidation points and Fibonacci markers support trading confidence and enhance the reliability of the wave count. This detailed forecast aims to assist traders in identifying and acting on potential trend shifts in a professional and timely manner.

Related

ASIAN PAINT Elliott Wave Analysis with Daily and Weekly Chart Forecasts, and Stock Trend Predictions for Smarter Trading

ASIAN PAINT Elliott Wave Analysis with Daily and Weekly Chart Forecasts, and Stock Trend Predictions for Smarter Trading

Elliott Wave analysis of ASIAN PAINT stock, highlighting corrective and impulsive wave patterns on b...

Read More >
Cochlear Limited (ASX:COH) Elliott Wave Analysis: Identifying Bullish Trends and Strategic Price Targets for Informed Trading

Cochlear Limited (ASX:COH) Elliott Wave Analysis: Identifying Bullish Trends and Strategic Price Targets for Informed Trading

Elliott Wave examination of Cochlear Limited (ASX:COH), highlighting the completion of a corrective ...

Read More >
Expert Guidance on CSL Limited ASX Stock with key Price Points and Forecasted Movements: CSL Elliott Wave Analysis

Expert Guidance on CSL Limited ASX Stock with key Price Points and Forecasted Movements: CSL Elliott Wave Analysis

This article provides an in-depth Elliott Wave analysis of CSL Limited (ASX: CSL), offering valuable...

Read More >
Euro/British Pound EURGBP Forex Elliott Wave Technical Analysis: In-Depth Insights for Daily and 4-Hour Charts

Euro/British Pound EURGBP Forex Elliott Wave Technical Analysis: In-Depth Insights for Daily and 4-Hour Charts

Our EURGBP Elliott Wave Analysis provides a thorough examination of the Euro against the British Pou...

Read More >
U.S. Dollar/Canadian Dollar (USDCAD) Forex Elliott Wave Technical Analysis: Daily and 4-Hour Chart Insights

U.S. Dollar/Canadian Dollar (USDCAD) Forex Elliott Wave Technical Analysis: Daily and 4-Hour Chart Insights

Explore the in-depth USD/CAD Elliott Wave Analysis covering daily and 4-hour chart insights. Our ana...

Read More >
GX Uranium ETF Elliott Wave Technical Analysis: Price Prediction, and Investment Opportunities in the Uranium Sector

GX Uranium ETF Elliott Wave Technical Analysis: Price Prediction, and Investment Opportunities in the Uranium Sector

GX Uranium ETF with the detailed Elliott Wave analysis. Understand key support levels, market trends...

Read More >

Buy 1 Month

Get 3 Months!

Special Offer:

Trade Recommendations

Unleash the power of deversified trading with our comprehensive portfolio, covering:

  • Stock Trades
  • Crypto Trades
  • Forex Trades
  • Commodity Trades
Elliott Wave Analysis

Gain a competive edge with expert insights in to:

  • Global Indices
  • US Stocks & ASX Stocks
  • Forex & Crypto
  • Commodities
Top-Notch Trading Tools

Equip yourself with the tools of success:

  • Social Chat
  • Elliott Wave Algorithm
  • Screener
  • TradingLevels
  • Trading Game
7 Elliott Wave Analysts

Stay ahead of the market with daily charts and insightful videos
-Your secret to strategic trading!

JOIN HERE


Welcome to TradingLounge (ASIC A.R.No. 321187), specialists in trades, trading education and technical analysis, covering stocks, indices, commodities, forex and cryptocurrencies.

When you join TradingLounge you have access to everything we offer, including trade tools, educational content and a social platform to chat with like-minded investors.

Read more

@Copyright 2024 by tradinglounge.com

Contact Us

Australian no: 02 4787 6020

International no: +61 (2) 47876020

Pay with:

Find us on