30Jun

Elliott Wave Forecast for BHP Group Limited Stock: Bullish Wave 3 Projection with Key Price Targets and Invalidation for ASX Traders

ASX: BHP GROUP LIMITED (BHP) Elliott Wave Technical Analysis TradingLounge Update

Welcome to today’s Elliott Wave update for ASX:BHP GROUP LIMITED – BHP. According to our latest technical analysis, BHP stock shows bullish potential, with wave 2)–orange now complete as a Zigzag pattern. Wave 3)–orange is currently in progress with the potential for further upward movement. Below, we outline the expected price targets and the critical invalidation level to watch.

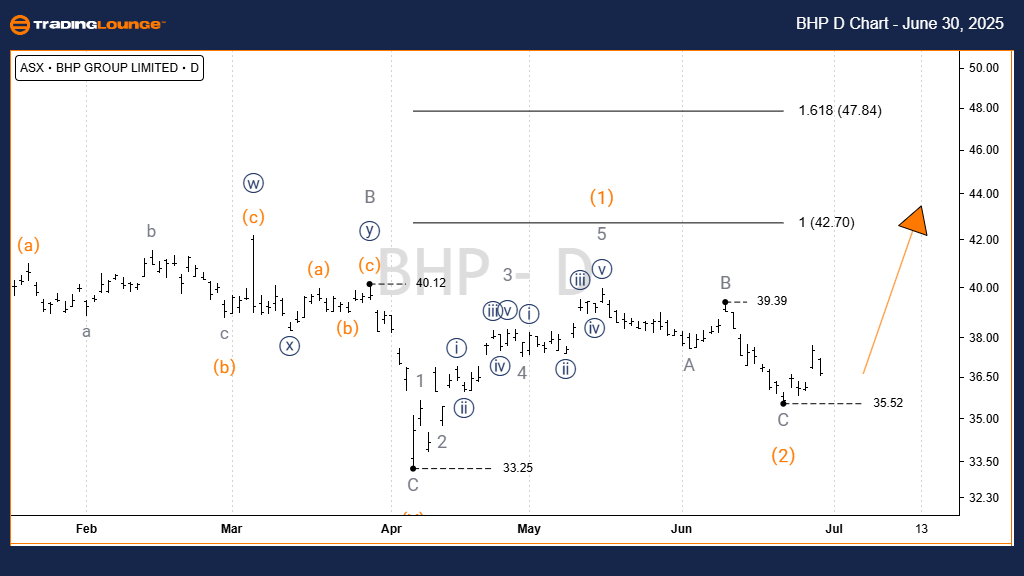
ASX: BHP GROUP LIMITED – BHP 1D Chart Analysis (Semilog Scale)

Function: Intermediate Trend (Orange Degree)

Wave Mode: Motive

Wave Structure: Impulse

Current Position: Wave 3)–orange

Technical Summary:

  • After bottoming at 33.25, wave 1)–orange formed a clear five-wave impulse.
  • Subsequently, wave 2)–orange completed as a standard A–B–C Zigzag correction.
  • This sets the stage for wave 3)–orange, projected to reach between 42.70 and 47.84.
  • For this upward Elliott Wave count to remain valid, the support level at 35.52 must hold.

Critical Invalidation Level: 35.52

BHP-asx-D-Chart-3006...


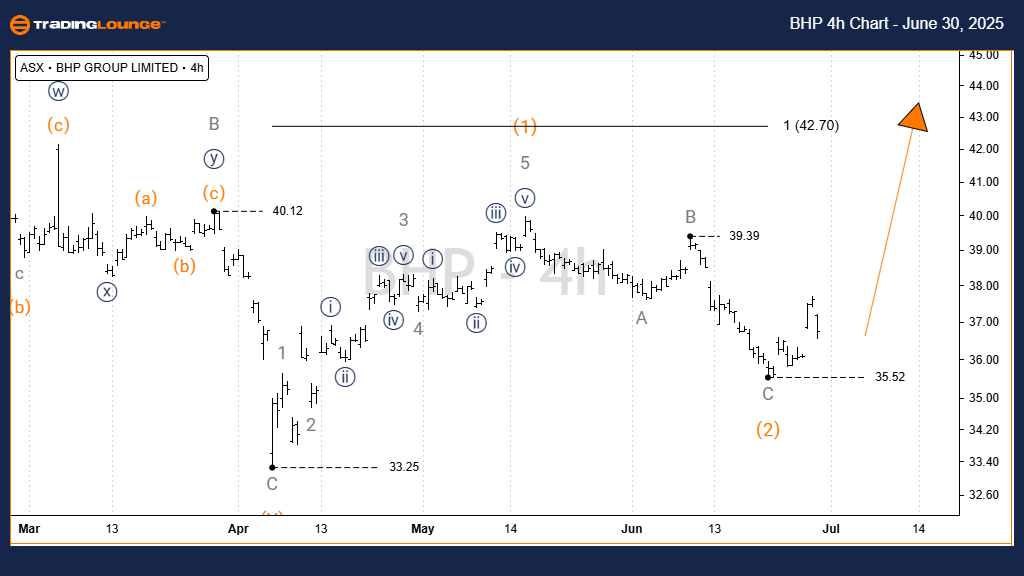
ASX: BHP GROUP LIMITED – BHP 4-Hour Chart Technical Analysis

Function: Intermediate Trend (Orange Degree)

Wave Mode: Motive

Wave Structure: Impulse

Current Position: Wave 3)–orange

Analysis Overview:

  • The 4-hour chart aligns with the daily view, confirming wave 3)–orange development.
  • A bullish trade setup may trigger once the price moves above the Entry level.
  • Maintaining support above 35.52 remains crucial to validate the bullish bias.

Critical Invalidation Level: 35.52

Technical Analyst: Hua (Shane) Cuong, CEWA-M (Master’s Designation).

Source: Visit Tradinglounge.com and learn from the Experts. Join TradingLounge Here 

See Previous: NEWMONT CORPORATION – NEM Elliott Wave Technical Analysis

VALUE Offer - $1 for 2 Weeks then $29 a month!Click here

Access 7 Analysts Over 200 Markets Covered. Chat Room With Support

BHP-asx-4h-Chart-300...


Conclusion:
Our Elliott Wave analysis for ASX: BHP offers a professional, objective outlook supported by clear price action signals. By specifying target zones and key invalidation levels, traders can increase confidence in directional bias and act accordingly. This structured approach helps identify profitable trading opportunities in BHP shares.

Related

Elliott Wave Analysis of ASX:NWS Stock Forecast with Impulse and Corrective Wave Patterns for NEWS CORPORATION Traders

Elliott Wave Analysis of ASX:NWS Stock Forecast with Impulse and Corrective Wave Patterns for NEWS CORPORATION Traders

Elliott Wave breakdown of News Corporation (ASX:NWS), covering impulse and corrective wave patterns,...

Read More >
Day and 4-hour Chart for British Pound/U.S.Dollar (GBPUSD) Elliott Wave Technical Analysis

Day and 4-hour Chart for British Pound/U.S.Dollar (GBPUSD) Elliott Wave Technical Analysis

Our GBP/USD Elliott Wave Analysis for the 4-hour chart on 13 March 24 suggests an ongoing impulsive ...

Read More >
Reliance Industries Stocks Elliott Wave Technical Analysis: Insights into Daily and 4-Hour Charts and Long-Term Market Outlook

Reliance Industries Stocks Elliott Wave Technical Analysis: Insights into Daily and 4-Hour Charts and Long-Term Market Outlook

This article provides a Technical analysis of Reliance Industries using the Elliott Wave theory. It ...

Read More >
Wheat Elliott Wave Technical Analysis: Navigating the Bearish Trend Towards a Potential Reversal

Wheat Elliott Wave Technical Analysis: Navigating the Bearish Trend Towards a Potential Reversal

In our analysis of Wheat's Elliott Wave patterns, we observe a persistent bearish trend since 20...

Read More >
Newmont Corporation ASX: NEM Elliott Wave Analysis Reveals Bullish Price Targets and Trading Signals for Gold Stock Investors

Newmont Corporation ASX: NEM Elliott Wave Analysis Reveals Bullish Price Targets and Trading Signals for Gold Stock Investors

Elliott Wave analysis for Newmont Corporation (ASX: NEM), highlighting key price targets, bullish st...

Read More >

$1 for 2 Weeks

then $29 a month!

What a Special Offer!

Trade Recommendations

Unleash the power of deversified trading with our comprehensive portfolio, covering 250+ markets:

  • Stock Trades
  • Crypto Trades
  • Forex Trades
  • Commodity Trades
Elliott Wave Analysis

Gain a competitive edge with expert insights and AI-powered Elliott Wave charting into:

  • Global Indices
  • US Stocks & ASX Stocks
  • Forex & Crypto
  • Commodities
Top-Notch Trading Tools

Equip yourself with the tools of success:

  • Real-time Chat rooms
  • Elliott Wave Algorithm
  • Portfolio tools
  • TradingLevels
  • Screener
  • Trading Game
7 Elliott Wave Analysts

Stay ahead of the market with daily charts and insightful videos
Your secret to strategic trading!

JOIN HERE


Welcome to TradingLounge (ASIC A.R.No. 321187), specialists in trades, trading education and technical analysis, covering stocks, indices, commodities, forex and cryptocurrencies.

When you join TradingLounge you have access to everything we offer, including trade tools, educational content and a social platform to chat with like-minded investors.

Read more

@Copyright 2024 by tradinglounge.com

Contact Us

Australian no: 02 4787 6020

International no: +61 (2) 47876020

Pay with:

Find us on