Mineral Resources Limited (MIN) - Elliott Wave Analysis Daily Chart

Welcome to today’s Elliott Wave analysis for the Australian Stock Exchange (ASX) ticker Mineral Resources Limited (MIN). According to our assessment, MIN.ASX may be on the verge of an upward movement in wave (iii)-orange within wave ((iii))-navy.

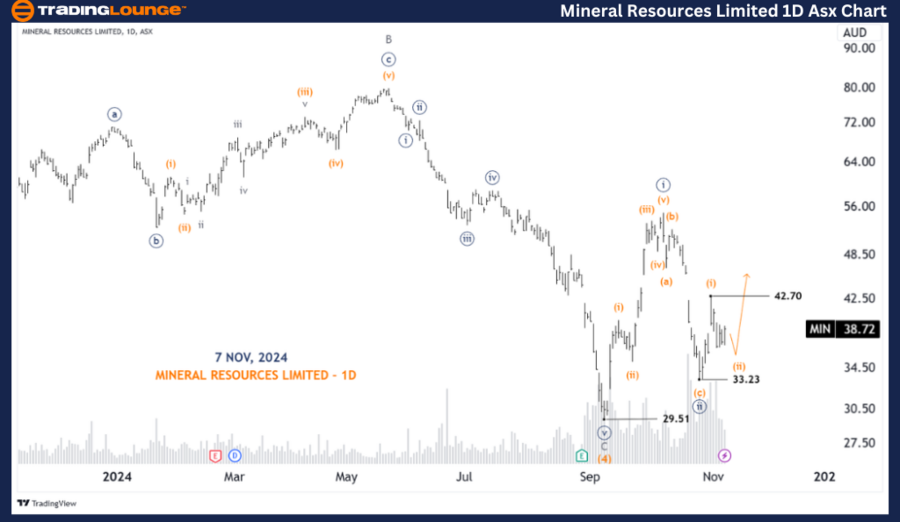
ASX: Mineral Resources Limited (MIN) - Daily Chart Analysis (1D, Semilog Scale)

ASX: MIN Elliott Wave Technical Analysis

Trend: Major trend at the Minute degree (navy)

Mode: Motive

Wave Structure: Impulse

Current Position: Wave (ii)-orange of Wave ((iii))-navy

Analysis Details:

Our analysis indicates that wave ((ii))-navy may have completed its formation as an (a)(b)(c)-orange zigzag. Starting from the 33.23 price point, wave ((iii))-navy is currently developing with an extended wave formation. This extended wave is expected to complete wave (ii)-orange soon, which should lead to the upward movement of wave (iii)-orange.

Invalidation Point: 33.23

Mineral-Resources-Li...


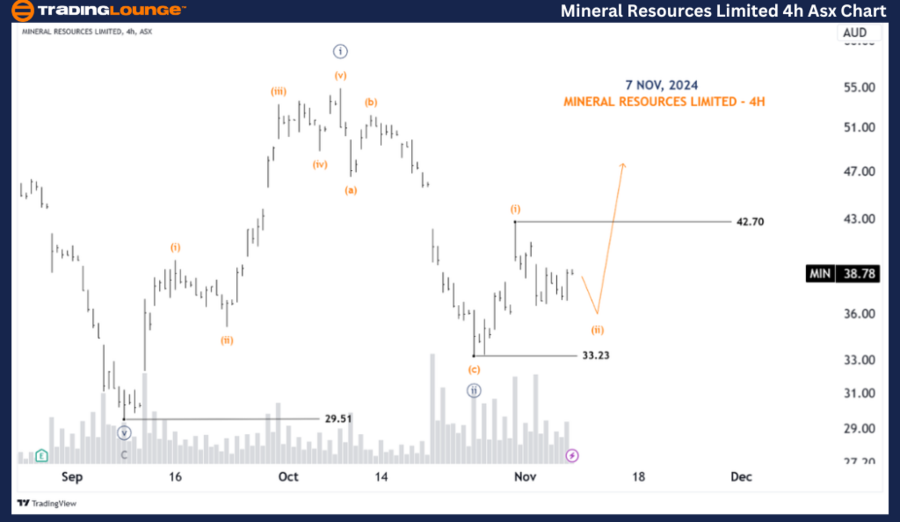
ASX: Mineral Resources Limited (MIN) - 4-Hour Chart Analysis

Trend: Major trend at the Minute degree (navy)

Mode: Motive

Wave Structure: Impulse

Current Position: Wave (ii)-orange of Wave ((iii))-navy

Analysis Details:

Starting from the low at 33.23, wave ((iii))-navy is progressing towards higher levels. Currently, this wave is subdividing into wave (ii)-orange. Although some instability is present, suggesting a possible brief decline, a confirmed upward push in wave (iii)-orange may follow. Additionally, if the price moves above 42.70, it would provide further confirmation that wave (iii)-orange is progressing.

Invalidation Point: 33.23

Confirmation Point: 42.70

Technical Analyst: Hua (Shane) Cuong, CEWA-M (Master’s Designation).

Source: visit Tradinglounge.com and learn From the Experts Join TradingLounge Here 

See Previous: REECE LIMITED - REH Elliott Wave Technical Analysis

VALUE Offer - Buy 1 Month & Get 3 Months!Click here

Access 7 Analysts Over 200 Markets Covered. Chat Room With Support

Mineral-Resources-Li...


Conclusion

Our updated Elliott Wave analysis of ASX: Mineral Resources Limited (MIN) offers a forecast of the key trends and market signals, presenting potential opportunities to capitalize on these movements. Specific price levels, such as the confirmation and invalidation points, provide clear indicators for our wave count. With these insights, we aim to give a comprehensive and objective perspective on the likely market trajectory for MIN, enabling informed trading decisions.

Related

CAC 40 Elliott Wave Technical Analysis: Discover the Best Strategies for Trading the France Index, Get Forecasts, and Stay Updated

CAC 40 Elliott Wave Technical Analysis: Discover the Best Strategies for Trading the France Index, Get Forecasts, and Stay Updated

This detailed CAC 40 analysis uses Elliott Wave analysis to provide insights into current market tre...

Read More >
ASX LNW Stock Analysis and Elliott Wave Forecast for Light & Wonder Inc. Share Price Trends, Market Outlook & Trading Strategies

ASX LNW Stock Analysis and Elliott Wave Forecast for Light & Wonder Inc. Share Price Trends, Market Outlook & Trading Strategies

ASX LNW stock analysis offers a comprehensive Elliott Wave forecast for Light & Wonder Inc., coverin...

Read More >
Microsoft Corp (MSFT:NASDAQ) Elliott Wave Technical Analysis 20 November 23

Microsoft Corp (MSFT:NASDAQ) Elliott Wave Technical Analysis 20 November 23

Trading Lounge Microsoft Corp.(MSFT: NASDAQ) Elliott Wave Technical Analysis on 20 November 23, MSFT...

Read More >
Bitcoin/U.S. dollar(BTCUSD) Elliott Wave Technical Analysis 17 October 23

Bitcoin/U.S. dollar(BTCUSD) Elliott Wave Technical Analysis 17 October 23

Trading lounge Bitcoin/U.S. dollar(BTCUSD) Elliott Wave Technical Analysis 4-hour and day charts for...

Read More >
Outlines the Future market movements with KOSPI Composite Index Elliott Wave Technical Analysis

Outlines the Future market movements with KOSPI Composite Index Elliott Wave Technical Analysis

This article provides an in-depth Elliott Wave analysis of the KOSPI Composite Index, covering both ...

Read More >
Predicting HDFC Bank’s Stock Movement and Identifying Key Target Levels using HDFCBANK Elliott Wave Technical Analysis

Predicting HDFC Bank’s Stock Movement and Identifying Key Target Levels using HDFCBANK Elliott Wave Technical Analysis

This analysis of HDFC Bank stock provides an in-depth look at its current trend using Elliott Wave t...

Read More >

Buy 1 Month

Get 3 Months!

Special Offer:

Trade Recommendations

Unleash the power of deversified trading with our comprehensive portfolio, covering:

  • Stock Trades
  • Crypto Trades
  • Forex Trades
  • Commodity Trades
Elliott Wave Analysis

Gain a competive edge with expert insights in to:

  • Global Indices
  • US Stocks & ASX Stocks
  • Forex & Crypto
  • Commodities
Top-Notch Trading Tools

Equip yourself with the tools of success:

  • Social Chat
  • Elliott Wave Algorithm
  • Screener
  • TradingLevels
  • Trading Game
7 Elliott Wave Analysts

Stay ahead of the market with daily charts and insightful videos
-Your secret to strategic trading!

JOIN HERE


Welcome to TradingLounge (ASIC A.R.No. 321187), specialists in trades, trading education and technical analysis, covering stocks, indices, commodities, forex and cryptocurrencies.

When you join TradingLounge you have access to everything we offer, including trade tools, educational content and a social platform to chat with like-minded investors.

Read more

@Copyright 2024 by tradinglounge.com

Contact Us

Australian no: 02 4787 6020

International no: +61 (2) 47876020

Pay with:

Find us on