13Dec

USDCAD Elliott Wave Technical Analysis: Explore Bullish Trends, Wave Structures, Technical Insights, Trading Strategies, and Key Forex Market Updates

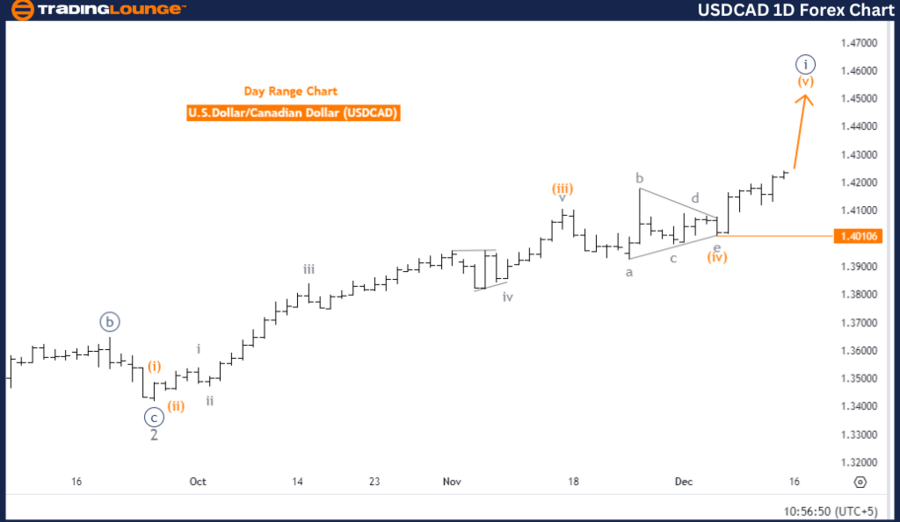
U.S. Dollar / Canadian Dollar (USDCAD) Elliott Wave Analysis - Trading Lounge Daily Chart

USDCAD Elliott Wave Technical Analysis

Function: Bullish Trend

Mode: Impulsive

Structure: Orange Wave 5

Position: Navy Blue Wave 1

Direction for Next Lower Degrees: Navy Blue Wave 2

Details

Current Status

  • Orange wave 4 appears completed.
  • Orange wave 5 of navy blue wave 1 is in progress.
  • Invalidation Level: 1.40106 (A drop below this level invalidates the current Elliott Wave structure).

Analysis Overview

The daily chart for USDCAD demonstrates a bullish trend based on Elliott Wave analysis. The impulsive mode highlights robust upward momentum within the wave structure.

Key Highlights

  • Wave Progression:

    • Orange wave 5 is unfolding within the broader navy blue wave 1 structure.
    • Completion of orange wave 4 signals sustained upward momentum for orange wave 5.
  • Final Phase:

    • Orange wave 5 marks the final phase of navy blue wave 1, reflecting strong bullish sentiment.
  • Upcoming Corrective Phase:

    • Navy blue wave 2, a potential corrective retracement, is anticipated as the next phase in the larger impulsive sequence.

Key Considerations

  1. Bullish Sentiment:
    • Orange wave 5 is actively driving prices upward, reinforcing a bullish outlook.
  2. Potential Reassessment:
    • A drop below 1.40106 would invalidate the current structure and necessitate reanalysis.

Strategic Implications for Traders

  • Capitalizing on the Trend:
    • Align trading strategies with the bullish momentum of orange wave 5 to leverage the ongoing uptrend.
  • Preparing for Corrective Wave 2:
    • Be ready for the potential navy blue wave 2 correction to manage risk effectively.
  • Close Observation:
    • Monitor price action and wave development closely to adapt strategies to market dynamics.

This Elliott Wave analysis outlines a clear bullish trajectory for USDCAD on the daily chart. Traders should remain vigilant to price levels and wave progression for optimized strategies during this phase.

USDCAD-1d-forex-char...


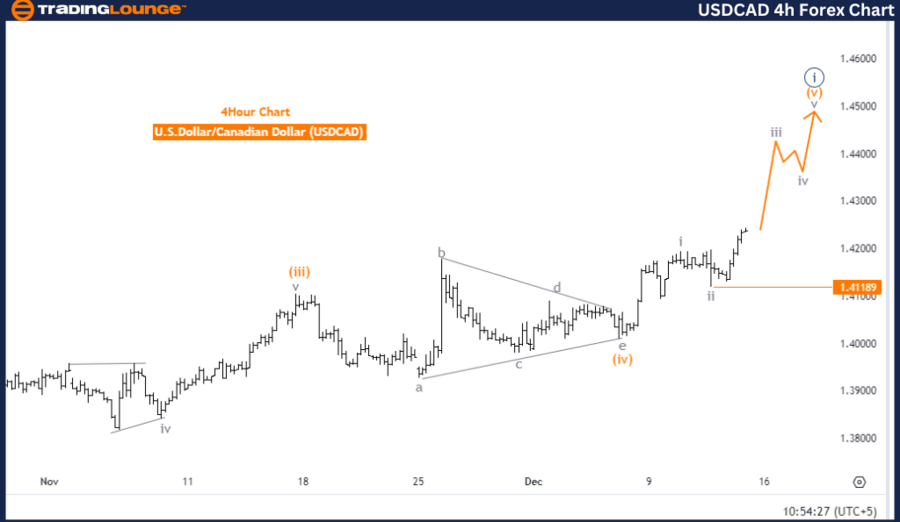
U.S. Dollar / Canadian Dollar (USDCAD) Elliott Wave Analysis - Trading Lounge- 4-Hour Chart Analysis

USDCAD Elliott Wave Technical Analysis

Function: Bullish Trend

Mode: Impulsive

Structure: Gray Wave 3

Position: Orange Wave 5

Direction for Next Lower Degrees: Gray Wave 4

Details

Current Status

  • Gray wave 2 appears completed.
  • Gray wave 3 is in progress, with the market positioned in orange wave 5.
  • Invalidation Level: 1.41189 (A drop below this level invalidates the current Elliott Wave structure).

Analysis Overview

The USDCAD 4-hour chart exhibits a bullish trend based on Elliott Wave analysis. The impulsive mode reflects strong upward momentum within gray wave 3, a critical phase of the ongoing uptrend.

Key Highlights

  • Wave Progression:

    • Gray wave 2 completion has initiated the active phase of gray wave 3.
    • The market is currently in orange wave 5, signaling the final stage of gray wave 3.
  • Upward Momentum:

    • Gray wave 3 is characterized by robust price increases and strong bullish sentiment.
  • Upcoming Correction:

    • Gray wave 4 is expected to follow gray wave 3, signaling a potential corrective phase in the broader impulsive sequence.

Key Considerations

  1. Bullish Sentiment:
    • The ongoing gray wave 3 phase aligns with a strong upward trajectory, suggesting further price gains.
  2. Potential Reassessment:
    • A drop below 1.41189 would negate the current Elliott Wave structure and require reevaluation.

Strategic Implications for Traders

  • Capitalizing on the Trend:
    • Exploit the sustained bullish momentum in gray wave 3 to align with the uptrend.
  • Preparing for Gray Wave 4:
    • Stay prepared for the corrective phase of gray wave 4 to manage risk and plan exits effectively.
  • Monitoring Sub-Waves:
    • Closely track orange wave 5 progression and key price levels for optimal market navigation.

This analysis emphasizes the strength of the USDCAD uptrend on the 4-hour chart, providing actionable insights for traders to align strategies with the prevailing bullish market conditions.

Technical Analyst: Malik Awais

Source: visit Tradinglounge.com and learn From the Experts Join TradingLounge Here 

Previous: GBPAUD Elliott Wave Technical Analysis 

VALUE Offer - Buy 1 Month & Get 3 Months!Click here

Access 7 Analysts Over 200 Markets Covered. Chat Room With Support

USDCAD-4h-forex-char...

Related

Theta Token (THETAUSD) Wave 4 Consolidation Near Fibonacci Support Points to Wave 5 Breakout Opportunity in Bullish Elliott Wave Setup

Theta Token (THETAUSD) Wave 4 Consolidation Near Fibonacci Support Points to Wave 5 Breakout Opportunity in Bullish Elliott Wave Setup

Theta Token (THETAUSD) is consolidating in wave 4 within a bullish Elliott Wave structure. A breakou...

Read More >
Explores the Current Stock Trends: NEWS CORPORATION. – NWS Stock Analysis & Elliott Wave Technical Forecast

Explores the Current Stock Trends: NEWS CORPORATION. – NWS Stock Analysis & Elliott Wave Technical Forecast

This detailed analysis provides an in-depth Elliott Wave forecast for ASX: News Corporation (NWS). T...

Read More >
S&P 500 Elliott Wave Analysis with Daily and Weekly Charts Highlighting Impulsive Trends, Wave Counts, and Market Forecasts

S&P 500 Elliott Wave Analysis with Daily and Weekly Charts Highlighting Impulsive Trends, Wave Counts, and Market Forecasts

S&P 500 Elliott Wave analysis on both daily and weekly timeframes. It outlines the current market po...

Read More >
MARA Holdings Inc. (MARA) U.S. Stocks Elliott Wave Technical Analysis: Shows Bullish Price Move and Weekly Resistance Nearing

MARA Holdings Inc. (MARA) U.S. Stocks Elliott Wave Technical Analysis: Shows Bullish Price Move and Weekly Resistance Nearing

This analysis of MARA Holdings uses Elliott Wave theory to project price moves on daily and weekly c...

Read More >
Shanghai Composite Index Elliott Wave Technical Analysis - SSE Investment Insights and Shanghai Composite trading

Shanghai Composite Index Elliott Wave Technical Analysis - SSE Investment Insights and Shanghai Composite trading

Gain a deep understanding of Shanghai Composite trading with expert Elliott Wave analysis and action...

Read More >
British Pound/U.S. Dollar (GBPUSD) Elliott Wave Forecast: Daily & 4H Chart Analysis Reveals Bullish Trend, Trade Setups

British Pound/U.S. Dollar (GBPUSD) Elliott Wave Forecast: Daily & 4H Chart Analysis Reveals Bullish Trend, Trade Setups

Elliott Wave analysis of GBPUSD with daily and 4-hour charts, covering wave counts, trade setups, in...

Read More >

$1 for 2 Weeks

then $29 a month!

What a Special Offer!

Trade Recommendations

Unleash the power of deversified trading with our comprehensive portfolio, covering 250+ markets:

  • Stock Trades
  • Crypto Trades
  • Forex Trades
  • Commodity Trades
Elliott Wave Analysis

Gain a competitive edge with expert insights and AI-powered Elliott Wave charting into:

  • Global Indices
  • US Stocks & ASX Stocks
  • Forex & Crypto
  • Commodities
Top-Notch Trading Tools

Equip yourself with the tools of success:

  • Real-time Chat rooms
  • Elliott Wave Algorithm
  • Portfolio tools
  • TradingLevels
  • Screener
  • Trading Game
7 Elliott Wave Analysts

Stay ahead of the market with daily charts and insightful videos
Your secret to strategic trading!

JOIN HERE


Welcome to TradingLounge (ASIC A.R.No. 321187), specialists in trades, trading education and technical analysis, covering stocks, indices, commodities, forex and cryptocurrencies.

When you join TradingLounge you have access to everything we offer, including trade tools, educational content and a social platform to chat with like-minded investors.

Read more

@Copyright 2024 by tradinglounge.com

Contact Us

Australian no: 02 4787 6020

International no: +61 (2) 47876020

Pay with:

Find us on