28May

NIFTY 50 Index Elliott Wave Technical Analysis Reveals Bullish Impulsive Trend with Strong Market Forecast and Support Level at 1621

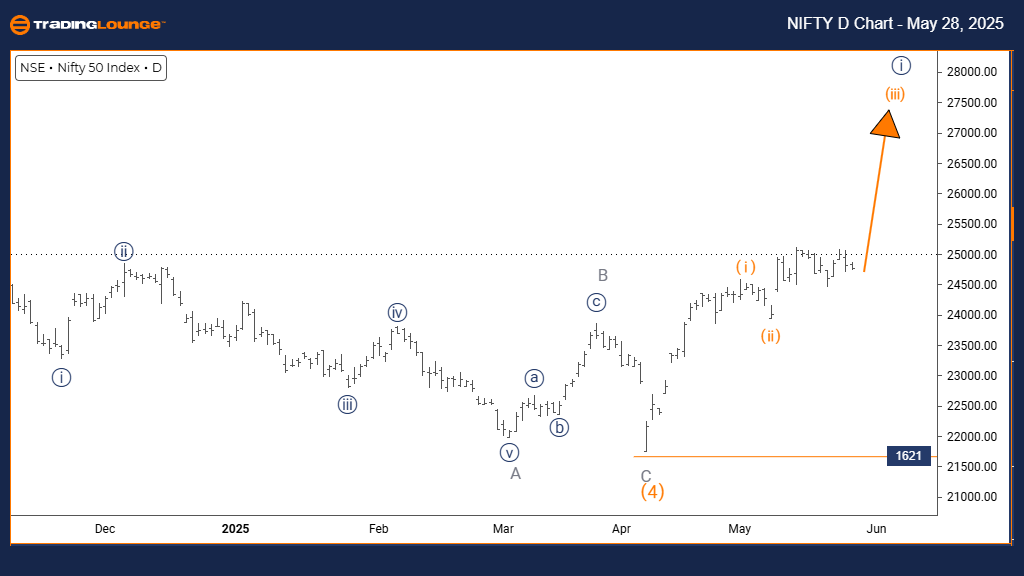
NIFTY 50 INDEX Elliott Wave Analysis – Trading Lounge Day Chart

NIFTY 50 INDEX Day Chart Analysis

NIFTY 50 Index Elliott Wave Technical Analysis

FUNCTION: Bullish Trend

MODE: Impulsive

STRUCTURE: Orange Wave 3

POSITION: Navy Blue Wave 1

DIRECTION (NEXT HIGHER DEGREES): Orange Wave 3 (initiated)

DETAILS: Orange wave 2 has concluded; orange wave 3 is now unfolding.
Wave Cancel Invalid Level: 1621

The daily Elliott Wave analysis for Nifty 50 signals a firm bullish trend currently underway. Orange wave 3 has begun developing within the broader impulsive wave cycle of navy blue wave 1. The completed orange wave 2 confirms the shift into this critical growth segment of the Elliott Wave pattern.

The transition confirms intensified buying activity, supporting the continuation of the bullish outlook. With the market structure nested inside navy blue wave 1, the Nifty 50 shows strong upward momentum. The critical invalidation threshold is 1621. If the index dips below this level, the current wave setup would be reevaluated for possible trend reversal or deeper correction.

This wave formation offers traders a precise technical roadmap, pointing to a potentially accelerated gain phase. As orange wave 3 progresses, it supports the broader bullish narrative and enhances investor confidence. The next forecast in higher wave degrees includes further progression of orange wave 3 within navy blue wave 1’s framework.

Key Takeaways:

  • Orange wave 3 active, suggesting increased bullish momentum
  • Wave 2 to 3 transition confirms strong buying behavior
  • Invalidation level at 1621 remains crucial to maintain outlook
  • Watch for breakout signals within orange wave 3 for trend confirmation

NIFTY-50-INDEX-Day-C...


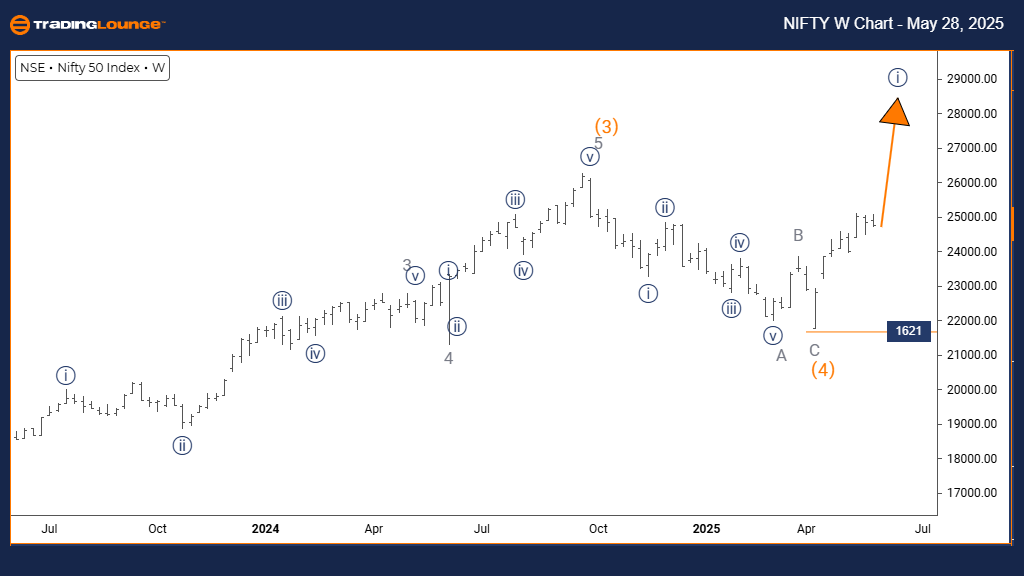
NIFTY 50 INDEX Elliott Wave Analysis – Trading Lounge Weekly Chart

NIFTY 50 Index Elliott Wave Technical Analysis

FUNCTION: Bullish Trend

MODE: Impulsive

STRUCTURE: Navy Blue Wave 1

POSITION: Gray Wave 1

DIRECTION (NEXT HIGHER DEGREES): Navy Blue Wave 1 (initiated)

DETAILS: Orange wave 4 is likely complete; navy blue wave 1 of gray wave 1 is now forming.

Wave Cancel Invalid Level: 1621

The weekly Elliott Wave forecast for Nifty 50 supports a continued bullish outlook, driven by the emergence of navy blue wave 1 within the larger trend of gray wave 1. The conclusion of orange wave 4 marks the end of corrective movement and the beginning of a new impulsive wave.

This development from corrective wave 4 to impulsive wave 1 implies a fresh phase of market strength. The chart suggests increasing institutional activity, often seen at the start of new bullish trends. The 1621 support level is key; falling below this threshold would challenge the current wave projection.

From a long-term perspective, navy blue wave 1 signifies the initial move within gray wave 1’s structure, hinting at a sustained rally in the coming sessions. The next projected move continues the navy blue wave 1 development inside the ongoing bullish cycle.

Key Takeaways:

  • Weekly trend confirms a bullish wave start post-correction
  • Transition into navy blue wave 1 suggests fresh market strength
  • 1621 is a critical invalidation point to monitor
  • Long-term structure aligns with continued upside momentum

Technical Analyst: Malik Awais

Source: Visit Tradinglounge.com and learn from the Experts. Join TradingLounge Here 

Previous: Hang Seng Index Elliott Wave Technical Analysis

VALUE Offer - Buy 1 Month & Get 3 Months!Click here

Access 7 Analysts Over 200 Markets Covered. Chat Room With Support

NIFTY-50-INDEX-weekl...

Related

Johnson & Johnson (JNJ) Elliott Wave Analysis: Understanding the Trend Direction and Potential Price Movements

Johnson & Johnson (JNJ) Elliott Wave Analysis: Understanding the Trend Direction and Potential Price Movements

Explore the Elliott Wave analysis for Johnson & Johnson (JNJ) focusing on trend direction and price ...

Read More >
DAX Elliott Wave Analysis: Explore Germany's Stock Market Trends, Bullish Forecasts, and Trading Strategies for 2025

DAX Elliott Wave Analysis: Explore Germany's Stock Market Trends, Bullish Forecasts, and Trading Strategies for 2025

DAX (Germany) Elliott Wave Analysis, highlighting key trends and forecasts for 2025. This analysis f...

Read More >
USDCHF Elliott Wave Analysis: Daily and 4-Hour Insights, Corrective Waves, Trading Strategies, Market Trends, and Risk Management

USDCHF Elliott Wave Analysis: Daily and 4-Hour Insights, Corrective Waves, Trading Strategies, Market Trends, and Risk Management

This article provides a comprehensive Elliott Wave analysis for USDCHF, covering daily and 4-hour ch...

Read More >
EURUSD Elliott Wave Forecast Shows Wave 4 Correction Nearing End With Bullish Wave 5 Setup and Key Level at 1.01781

EURUSD Elliott Wave Forecast Shows Wave 4 Correction Nearing End With Bullish Wave 5 Setup and Key Level at 1.01781

EURUSD is in a corrective wave 4 phase, offering a trading opportunity before the expected bullish w...

Read More >
McDonald’s Corp.(MCD:NYSE) Elliott Wave Technical Analysis 22 January 24

McDonald’s Corp.(MCD:NYSE) Elliott Wave Technical Analysis 22 January 24

McDonald’s Corp.(MCD: NYSE) Elliot Wave Technical Analysis dated 22 January 24, TradingLounge Stock...

Read More >
Visa Inc. (V) Elliott Wave Analysis: Forecast $380 Resistance, Wave {iv} Correction Incoming Before Final Push in Wave (v)

Visa Inc. (V) Elliott Wave Analysis: Forecast $380 Resistance, Wave {iv} Correction Incoming Before Final Push in Wave (v)

Visa Inc. (V) shows a strong Elliott Wave uptrend toward $380, with an anticipated wave {iv} correct...

Read More >

$1 for 2 Weeks

then $29 a month!

What a Special Offer!

Trade Recommendations

Unleash the power of deversified trading with our comprehensive portfolio, covering 250+ markets:

  • Stock Trades
  • Crypto Trades
  • Forex Trades
  • Commodity Trades
Elliott Wave Analysis

Gain a competitive edge with expert insights and AI-powered Elliott Wave charting into:

  • Global Indices
  • US Stocks & ASX Stocks
  • Forex & Crypto
  • Commodities
Top-Notch Trading Tools

Equip yourself with the tools of success:

  • Real-time Chat rooms
  • Elliott Wave Algorithm
  • Portfolio tools
  • TradingLevels
  • Screener
  • Trading Game
7 Elliott Wave Analysts

Stay ahead of the market with daily charts and insightful videos
Your secret to strategic trading!

JOIN HERE


Welcome to TradingLounge (ASIC A.R.No. 321187), specialists in trades, trading education and technical analysis, covering stocks, indices, commodities, forex and cryptocurrencies.

When you join TradingLounge you have access to everything we offer, including trade tools, educational content and a social platform to chat with like-minded investors.

Read more

@Copyright 2024 by tradinglounge.com

Contact Us

Australian no: 02 4787 6020

International no: +61 (2) 47876020

Pay with:

Find us on