20Mar

ASX: Newmont Corporation (NEM) Elliott Wave Analysis – Stock Forecast, Price Target, Trading Strategy & Market Trends for Investors

ASX: Newmont Corporation (NEM) Elliott Wave Technical Analysis – TradingLounge

Introduction

Welcome to today’s Elliott Wave analysis for Newmont Corporation (NEM) on the Australian Stock Exchange (ASX). This report highlights the long-term upside potential in ASX:NEM shares based on a detailed Elliott Wave assessment.


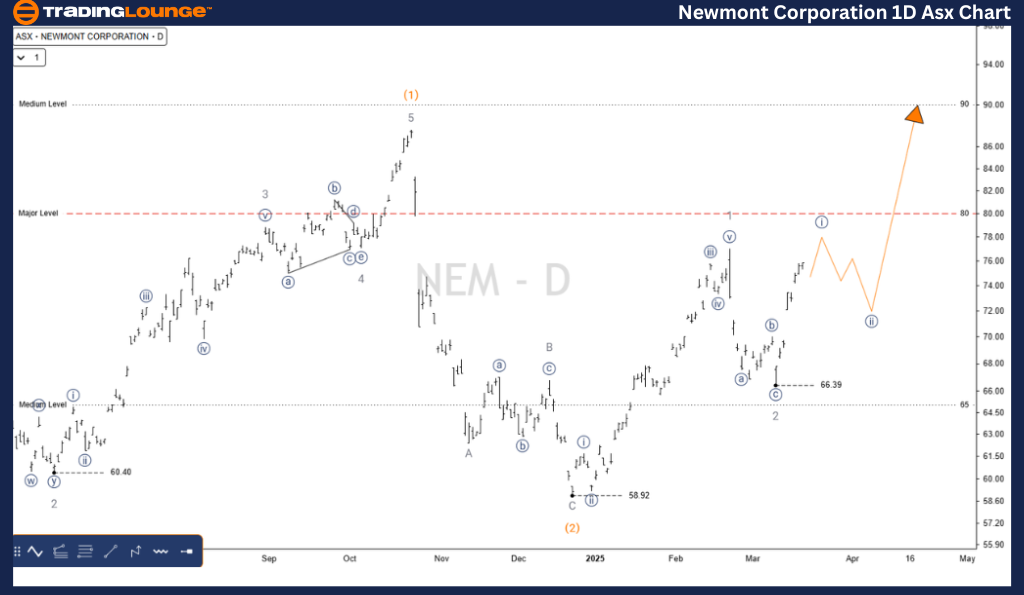
ASX: Newmont Corporation (NEM) Elliott Wave Technical Analysis – 1D Chart (Semilog Scale)

Function: Major Trend (Intermediate Degree, Orange)

Mode: Motive

Structure: Impulse

Position: Wave 3-Grey of Wave (3)-Orange

Analysis Overview

  • The wave count has been revised from the previous week to enhance probability.
  • Correction Wave (2)-Orange has been completed at the low of 58.92, signaling the emergence of Wave (3)-Orange, which is moving upward.
  • The subwave structure confirms:

             Wave 1-Grey has already completed.

             Wave 2-Grey appears completed, setting up the next upward movement.

             Wave 3-Grey is now projected to rise higher, targeting the 100.00 price level.

🔹 Invalidation Point: 66.39

NEWMONT-CORPORATION-...


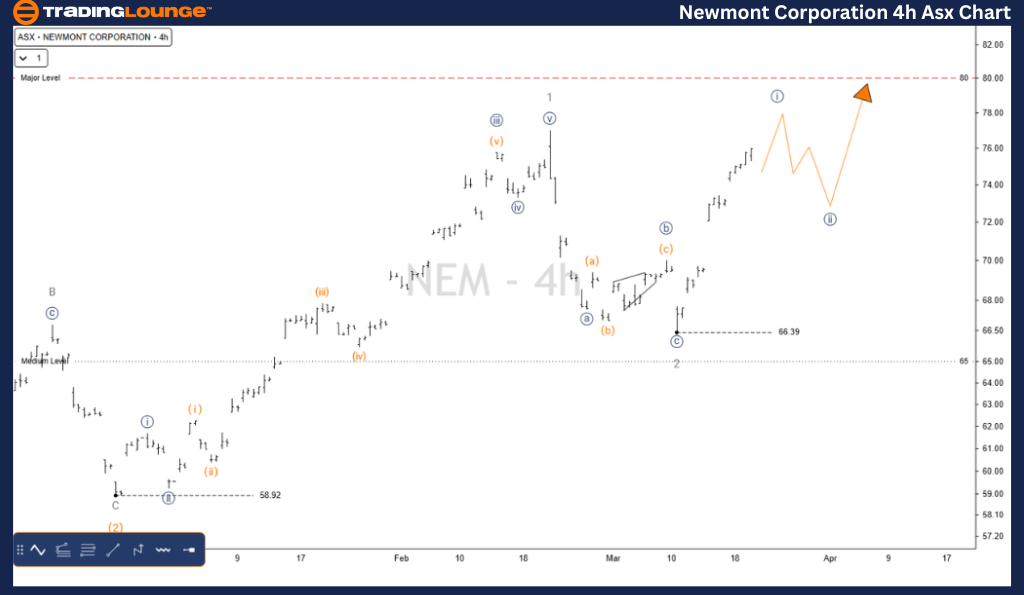
ASX: Newmont Corporation (NEM) 4-Hour Chart Analysis

Function: Major Trend (Minor Degree, Grey)

Mode: Motive

Structure: Impulse

Position: Wave ((i))-Navy of Wave 3-Grey

Analysis Overview

The 4-hour chart offers a closer perspective:

  • Wave ((i))-Navy is approaching completion from the 66.39 level.
  • A temporary pullback in Wave ((ii))-Navy is expected, likely forming an ABC correction.
  • Once completed, Wave ((iii))-Navy is anticipated to move significantly higher.

🔹 Invalidation Point: 66.39

Technical Analyst: Hua (Shane) Cuong, CEWA-M (Master’s Designation).

Source: Visit Tradinglounge.com and learn from the Experts. Join TradingLounge Here 

See Previous: BLOCK INC Elliott Wave Technical Analysis

VALUE Offer - Buy 1 Month & Get 3 Months!Click here

Access 7 Analysts Over 200 Markets Covered. Chat Room With Support

NEWMONT-CORPORATION-...


Conclusion

This Elliott Wave analysis delivers a clear outlook on ASX:NEM, combining trend forecasts and short-term market insights. By pinpointing key price levels for validation and invalidation, traders can confidently navigate potential trading opportunities.

Our strategic approach enhances trading decisions, providing an objective and professional perspective on market movements.

Related

USDCHF Forex Elliott Wave Analysis: U.S. Dollar / Swiss Franc Currency Pair Technical Insights and Trading Strategies

USDCHF Forex Elliott Wave Analysis: U.S. Dollar / Swiss Franc Currency Pair Technical Insights and Trading Strategies

The USDCHF Elliott Wave analysis highlights bullish trends on daily and 4-hour charts. Orange wave 5...

Read More >
British Pound / U.S. Dollar Forex Pair Analysis and GBPUSD Elliott Wave Technical Analysis to Guide your Trading Strategy

British Pound / U.S. Dollar Forex Pair Analysis and GBPUSD Elliott Wave Technical Analysis to Guide your Trading Strategy

The latest GBPUSD Elliott Wave analysis looks at the current counter-trend phase, focusing on orange...

Read More >
Elliott Wave Technical Analysis of AAVE/USD: Navigating the Wave Patterns for Strategic Trading

Elliott Wave Technical Analysis of AAVE/USD: Navigating the Wave Patterns for Strategic Trading

This article provides an in-depth Elliott Wave Analysis of the AAVE/USD cryptocurrency pair, offerin...

Read More >
Expert EURGBP Elliott Wave Analysis: Uncover Trends, Forecasts, and Proven Trading Strategies for Success

Expert EURGBP Elliott Wave Analysis: Uncover Trends, Forecasts, and Proven Trading Strategies for Success

This article provides an in-depth EURGBP Elliott Wave analysis, focusing on the current wave count, ...

Read More >
Bitcoin/ U.S. dollar: Unlocking Bitcoin Trading Potential with BTCUSD Elliott Wave Technical Analysis

Bitcoin/ U.S. dollar: Unlocking Bitcoin Trading Potential with BTCUSD Elliott Wave Technical Analysis

Explore the dynamics of BTCUSD trading using Elliott Wave Analysis. Learn about wave structures, tec...

Read More >
NIKKEI 225 (N225) Elliott Wave Analysis: Bullish Trend, Orange Wave 1 and Navy Blue Wave 3 with Risk Management Insights.

NIKKEI 225 (N225) Elliott Wave Analysis: Bullish Trend, Orange Wave 1 and Navy Blue Wave 3 with Risk Management Insights.

A comprehensive breakdown of the NIKKEI 225 Elliott Wave structure for daily and weekly charts. The ...

Read More >

Buy 1 Month

Get 3 Months!

Special Offer:

Trade Recommendations

Unleash the power of deversified trading with our comprehensive portfolio, covering:

  • Stock Trades
  • Crypto Trades
  • Forex Trades
  • Commodity Trades
Elliott Wave Analysis

Gain a competive edge with expert insights in to:

  • Global Indices
  • US Stocks & ASX Stocks
  • Forex & Crypto
  • Commodities
Top-Notch Trading Tools

Equip yourself with the tools of success:

  • Social Chat
  • Elliott Wave Algorithm
  • Screener
  • TradingLevels
  • Trading Game
7 Elliott Wave Analysts

Stay ahead of the market with daily charts and insightful videos
-Your secret to strategic trading!

JOIN HERE


Welcome to TradingLounge (ASIC A.R.No. 321187), specialists in trades, trading education and technical analysis, covering stocks, indices, commodities, forex and cryptocurrencies.

When you join TradingLounge you have access to everything we offer, including trade tools, educational content and a social platform to chat with like-minded investors.

Read more

@Copyright 2024 by tradinglounge.com

Contact Us

Australian no: 02 4787 6020

International no: +61 (2) 47876020

Pay with:

Find us on