In the fast-paced world of cryptocurrency trading, staying ahead requires keen insights and strategic approaches. Explore the latest Elliott Wave Analysis for Chainlink/USD (LINKUSD) to uncover potential profit opportunities and navigate market shifts with confidence.
Elliott Wave Analysis for LINKUSD - Daily Chart Insights
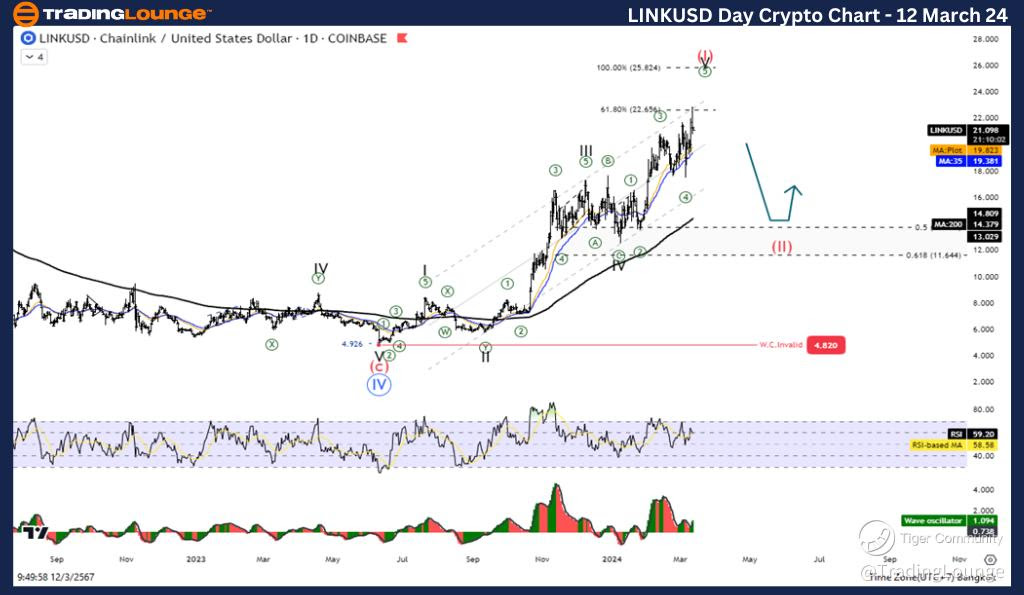
At the heart of Elliott Wave Analysis lies a powerful tool for deciphering market trends and identifying potential trading opportunities. Delving into the Daily Chart for Chainlink/USD (LINKUSD), we find compelling insights:
Chainlink/ U.S. dollar(LINKUSD) Daily Chart Analysis
LINKUSD Elliott Wave Technical Analysis
Function: Follow Trend
Mode: Motive
Structure: Impulse
Position: Wave V
Direction Next higher Degrees: Wave (I) of Impulse
Wave Cancel invalid Level: 8.498
According to our analysis, Chainlink/USD (LINKUSD) is currently positioned within Wave V of an Impulse structure, signalling a continuation of the prevailing trend. As Wave 5 unfolds and expands, the potential for further upside movement remains promising.
Trading Strategy Considerations
While the upward trajectory of Chainlink/USD (LINKUSD) presents enticing prospects, prudent traders exercise caution, especially during the latter stages of Wave 5. As the market approaches a potential correction or trend reversal, maintaining vigilance becomes paramount.
Technical Indicators: Unlocking Insights
Harnessing the power of technical indicators provides additional confirmation and insight into market dynamics. Key indicators for Chainlink/USD (LINKUSD) include:
Price above the MA200: Signaling an Uptrend Bullish Momentum on Wave Oscillator
These indicators corroborate the bullish sentiment surrounding Chainlink/USD (LINKUSD) and further reinforce the potential for continued upward movement.
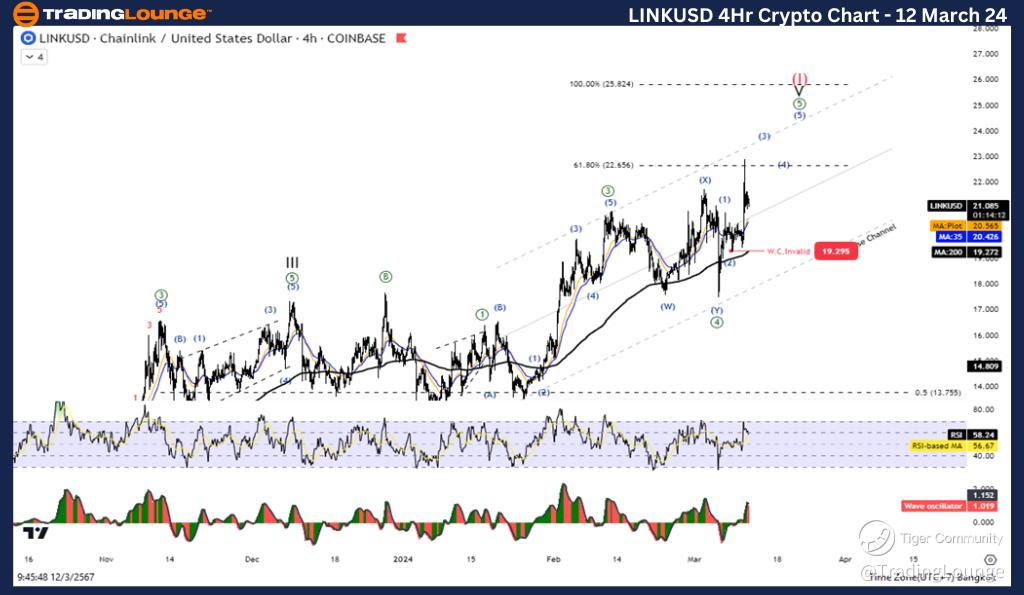
LINKUSD Elliott Wave Analysis TradingLounge - 4Hr Chart Exploration
Venturing into the 4-hour chart unveils further nuances and opportunities within the Chainlink/USD (LINKUSD) market:
Chainlink/ U.S. dollar(LINKUSD) 4Hr Chart Analysis
LINKUSD Elliott Wave Technical Analysis
Function: Follow Trend
Mode: Motive
Structure: Impulse
Position: Wave V
Direction Next higher Degrees: Wave (I) of Impulse
Wave Cancel invalid Level: 8.498
Echoing our Daily Chart analysis, the 4-hour chart reaffirms the presence of Wave V within an Impulse structure, indicating a sustained uptrend. As Wave 5 extends its reach, the potential for continued expansion remains a focal point for traders.
Crafting a Strategic Approach
Building a robust trading strategy requires a comprehensive understanding of market dynamics and a proactive stance towards risk management. While the current uptrend in Chainlink/USD (LINKUSD) presents opportunities, traders must remain vigilant and adaptable in the face of potential market shifts.
Technical Indicators: Illuminating Market Trends
Diving deeper into technical indicators offers valuable insights into market sentiment and potential price movements:
Price above the MA200: Reflecting an Uptrend Bullish Momentum on Wave Oscillator
These indicators align with our Elliott Wave Analysis findings, underlining the bullish momentum driving Chainlink/USD (LINKUSD) and reinforcing the potential for further upside movement.
In Conclusion
The realm of cryptocurrency trading is replete with opportunities for savvy investors, and Elliott Wave Analysis serves as a potent tool for navigating market dynamics. By leveraging insights from both daily and 4-hour charts, traders can position themselves strategically to capitalize on emerging trends and maximize profit potential.
As Chainlink/USD (LINKUSD) continues its upward trajectory within Wave V, traders are advised to proceed with caution, remaining vigilant for signs of a potential correction or trend reversal. With a keen eye on technical indicators and a proactive approach to risk management, traders can unlock the full potential of the Chainlink/USD (LINKUSD) market and seize lucrative opportunities amidst market fluctuations.
Technical Analyst: Kittiampon Somboonsod, CEWA
Source: visit Tradinglounge.com and learn From the Experts Join TradingLounge Here
See Previous: Bitcoin/ U.S. dollar(BTCUSD)
TradingLounge Once Off SPECIAL DEAL: Here > 1 month Get 3 months.