26Nov

Axis Bank ltd. Elliott WaveTechnical Analysis: Stock Price Forecast, Resistance Levels, and Trading Strategy

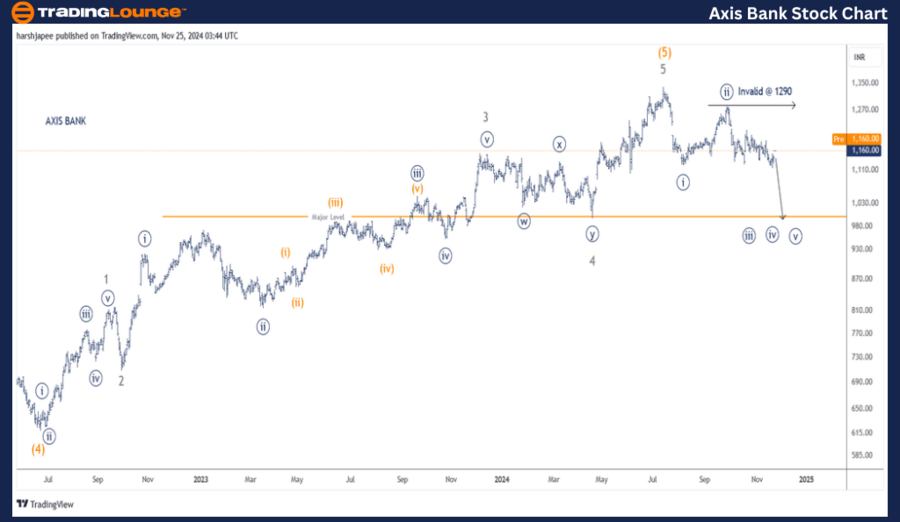
AXIS BANK LTD – AXISBANK (1D Chart) Elliott Wave Technical Analysis

AXISBANK Elliott Wave Technical Analysis

Function: Counter Trend (Minor degree, Grey. Wave A unfolding)

Mode: Corrective

Structure: Potential Impulse

Position: Minute Wave ((ii)) Navy of 1/A complete

Details: Minute Wave ((iii)) Navy is progressing towards the 1000 level, with an invalidation point at 1290, where risks have been tightened.

AXISBANK Daily Chart Technical Analysis and Potential Elliott Wave Counts

The AXISBANK daily chart suggests a potential bearish reversal after reaching the 1340 high, marking the termination of Intermediate Wave (5) Orange. This level indicates the potential end of the strong uptrend, with the stock now trending lower against the 1340 resistance.

  • Historical Insights:
    Intermediate Wave (4) Orange concluded near the 620 level in June 2022. Since then, a clear five-wave rally from Minor Waves 1 through 5 was observed, peaking near 1340.

  • Current Movement:
    If this wave count is correct, the stock's trend may now be moving lower, targeting the 1000 mark.
    Minute Waves ((i)) and ((ii)) seem to have completed at approximately 1130 and 1290 levels, respectively. Currently, Minute Wave ((iii)) appears to be progressing downward against the 1290 high.

AXIS-BANK-1d-stock-c...


AXIS BANK LTD – AXISBANK (4H Chart) Elliott Wave Technical Analysis

Function: Counter Trend (Minor degree, Grey. Wave A unfolding)

Mode: Corrective

Structure: Potential Impulse

Position: Minute Wave ((ii)) Navy of 1/A complete

Details: Minute Wave ((iii)) Navy is now unfolding towards the 1000 level, invalidation at 1290, with tightened risks.

AXISBANK 4H Chart Technical Analysis and Potential Elliott Wave Counts

The 4H chart provides a detailed view of the sub-waves following the termination of Minor Wave 3 at 1154 in December 2023.

  • Minor Wave 4 developed as a combination structure before an impulsive Wave 5 completed near the 1340 level.
  • Since this peak, the stock appears to have reversed lower, forming an impulsive structure at the Minute Degree, with the 1290 level acting as the invalidation point.

Technical Analyst: Harsh Japee

Source: visit Tradinglounge.com and learn From the Experts Join TradingLounge Here 

Previous: CIPLA Elliott Wave Technical Analysis

VALUE Offer - Buy 1 Month & Get 3 Months!Click here

Access 7 Analysts Over 200 Markets Covered. Chat Room With Support

AXIS-BANK-1d-stock-c...


Conclusion:

AXISBANK is unfolding within Minute Wave ((iii)) targeting lower levels near 1000, while invalidation remains set at 1290. The broader trend now seems bearish based on the Elliott Wave structure.

Related

Optimize Your Asx Trading Strategies: RESMED INC - RMD Stock Analysis & Elliott Wave Technical Forecast

Optimize Your Asx Trading Strategies: RESMED INC - RMD Stock Analysis & Elliott Wave Technical Forecast

This article provides a comprehensive Elliott Wave analysis of ASX: ResMed Inc (RMD), offering insig...

Read More >
Comprehensive Dogecoin Elliott Wave Analysis: Technical Insights and Effective Trading Strategies for DOGEUSD

Comprehensive Dogecoin Elliott Wave Analysis: Technical Insights and Effective Trading Strategies for DOGEUSD

Our comprehensive Dogecoin Elliott Wave analysis provides expert technical insights into DOGEUSD. Le...

Read More >
Comprehensive Stock Market Indices Analysis: S&P 500, NASDAQ 100, RUSSELL 2000, DAX 40, FTSE 100, ASX 200 | Elliott Wave Insights

Comprehensive Stock Market Indices Analysis: S&P 500, NASDAQ 100, RUSSELL 2000, DAX 40, FTSE 100, ASX 200 | Elliott Wave Insights

The S&P 500 and NASDAQ 100 are currently in a bullish Elliott Wave pattern, specifically in wave (ii...

Read More >
Microsoft Inc. (MSFT) Elliott Wave Analysis: Stock Forecast, Price Prediction & Market Trends for Bullish or Bearish Reversal

Microsoft Inc. (MSFT) Elliott Wave Analysis: Stock Forecast, Price Prediction & Market Trends for Bullish or Bearish Reversal

MSFT Elliott Wave analysis examines Microsoft stock's trend using Elliott Wave Theory to identif...

Read More >
Understand PYPL’s Market Direction and Anticipated Price Movements: PayPal Holdings Inc. Stocks Elliott Wave Technical Analysis

Understand PYPL’s Market Direction and Anticipated Price Movements: PayPal Holdings Inc. Stocks Elliott Wave Technical Analysis

This analysis of PayPal Holdings Inc. (PYPL) offers a detailed look at both daily and 1-hour chart p...

Read More >
Euro/U.S. Dollar (EURUSD) Elliott Wave Analysis: Forex Market Trends, Price Action Predictions, and Trading Strategy Insights

Euro/U.S. Dollar (EURUSD) Elliott Wave Analysis: Forex Market Trends, Price Action Predictions, and Trading Strategy Insights

This EUR/USD Elliott Wave Analysis provides a detailed technical outlook on the Forex market trend, ...

Read More >

Buy 1 Month

Get 3 Months!

Special Offer:

Trade Recommendations

Unleash the power of deversified trading with our comprehensive portfolio, covering:

  • Stock Trades
  • Crypto Trades
  • Forex Trades
  • Commodity Trades
Elliott Wave Analysis

Gain a competive edge with expert insights in to:

  • Global Indices
  • US Stocks & ASX Stocks
  • Forex & Crypto
  • Commodities
Top-Notch Trading Tools

Equip yourself with the tools of success:

  • Social Chat
  • Elliott Wave Algorithm
  • Screener
  • TradingLevels
  • Trading Game
7 Elliott Wave Analysts

Stay ahead of the market with daily charts and insightful videos
-Your secret to strategic trading!

JOIN HERE


Welcome to TradingLounge (ASIC A.R.No. 321187), specialists in trades, trading education and technical analysis, covering stocks, indices, commodities, forex and cryptocurrencies.

When you join TradingLounge you have access to everything we offer, including trade tools, educational content and a social platform to chat with like-minded investors.

Read more

@Copyright 2024 by tradinglounge.com

Contact Us

Australian no: 02 4787 6020

International no: +61 (2) 47876020

Pay with:

Find us on