TradingLounge 1D Chart – CIPLA Elliott Wave Technical Analysis
CIPLA India Day Chart Analysis
CIPLA Elliott Wave Technical Analysis
Function: Counter Trend (Minor Degree Grey)
Mode: Corrective
Structure: Impulse within larger degree Corrective Structure
Position: Minor Wave 1 Grey
Details:
Invalidation point: 1705
CIPLA Daily Chart Technical Analysis and Potential Elliott Wave Counts:
-
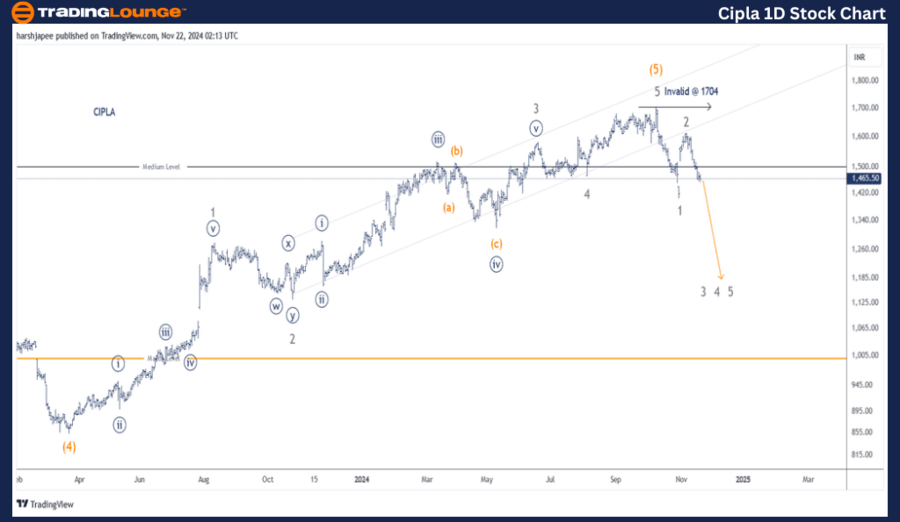
CIPLA’s daily chart suggests a potential end to its larger degree uptrend near the 1705 mark, as prices reversed lower after breaking below 1470, the previous Wave 4 of a lesser degree.
-
Wave 2 rally peaked at 1615, indicating completion, as bearish momentum drags prices lower.
-
Earlier, the stock ended Intermediate Wave (4) near 850 in March 2023. A subsequent impulse rally through 1705 marked a completed trend, transferring control to the bears.
-
Alternatively, the recent dip to 1400 could indicate Minor Wave 4, with bulls possibly working toward a Wave 5 rally.

CIPLA – CIPLA (4H Chart) Elliott Wave Technical Analysis
Function: Counter Trend (Minor Degree Grey)
Mode: Corrective
Structure: Impulse within larger degree Corrective Structure
Position: Minor Wave 1 Grey
Details:
Invalidation point: 1705
CIPLA 4H Chart Technical Analysis and Potential Elliott Wave Counts:
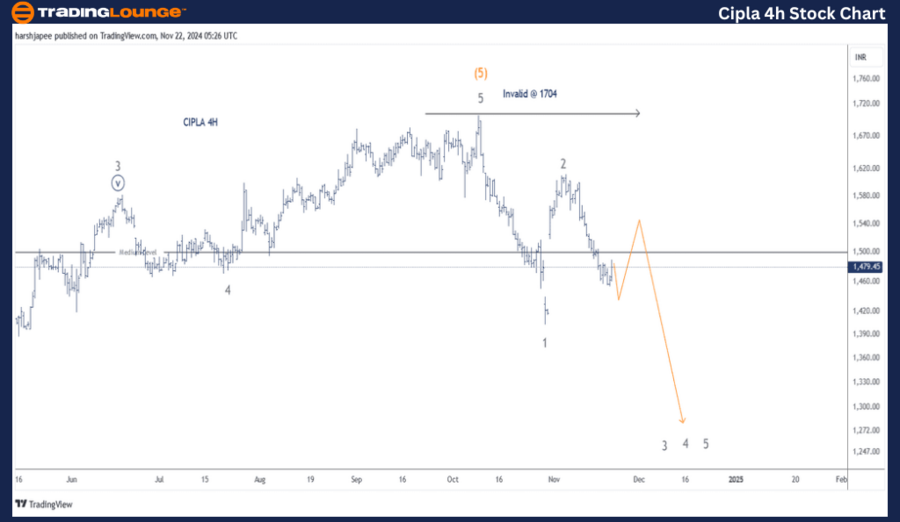
- The 4H chart highlights key wave counts since Minor Wave 4 ended near 1470 in August 2024.
- Minor Wave 5, appearing complete at 1704, preceded a sharp reversal below 1470.
- Minor Wave 1 ended at 1400, followed by a Wave 2 rally to 1615. The ongoing Minor Wave 3 targets a potential drop toward 1250 or lower.
Technical Analyst: Harsh Japee
Source: visit Tradinglounge.com and learn From the Experts Join TradingLounge Here
Previous: SUN PHARMACEUTICALS Elliott Wave Technical Analysis
VALUE Offer - Buy 1 Month & Get 3 Months!Click here
Access 7 Analysts Over 200 Markets Covered. Chat Room With Support

Conclusion:
CIPLA is moving downward within Minor Wave 3, with the 1705 level acting as a significant invalidation point for bearish scenarios.