SUN PHARMACEUTICALS – SUNPHARMA Elliott Wave Analysis (1D Chart)
SUN PHARMACEUTICALS Elliott Wave Technical Analysis
Function: Larger Degree Trend Higher (Intermediate Degree Orange)
Mode: Motive
Structure: Impulse
Position: Minute Wave ((v)) Navy
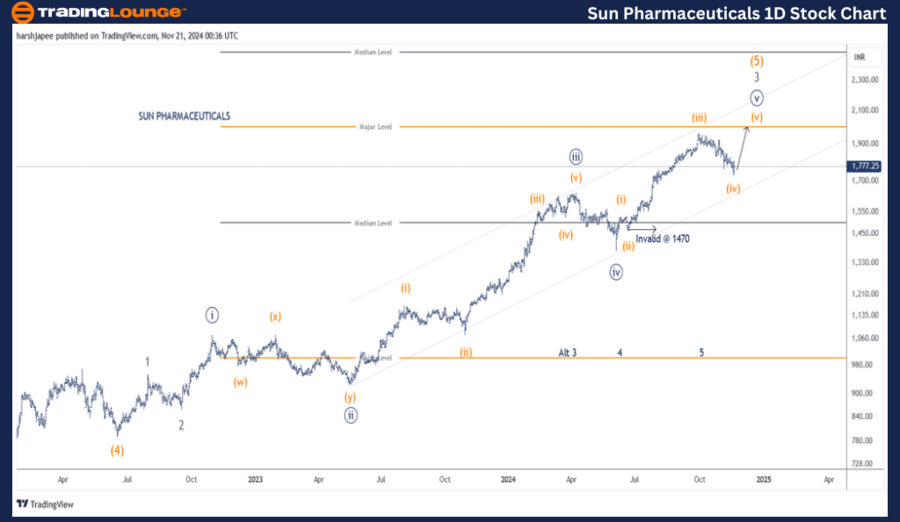
Details: Minute Wave ((v)) of Minor Wave 3 Grey appears to be advancing toward the 2000 level. The risk has been adjusted to 1470 to accommodate potential corrective movements. Minuette Wave (iv) Orange might have concluded around the 1750 zone, paving the way for bulls to resume their upward momentum. Alternatively, the possibility exists that Minor Waves 3, 4, and 5 have already completed as marked, signaling the onset of a larger-degree corrective wave.
Invalidation Point: 1470
SUN PHARMACEUTICAL Daily Chart Technical Analysis and Potential Elliott Wave Counts
The daily chart for SUN PHARMACEUTICAL indicates a strong upward trend targeting the 2000 level and beyond. The stock continues to extend its Minor Wave 3, with Minute Wave ((v)) Orange currently progressing against the 1470 low.
Since the completion of Intermediate Wave (4) at the 785 mark in June 2022, the stock has developed Minor Waves 1 and 2, with Wave 3 actively unfolding as an extension. Alternatively, Minor Waves 3, 4, and 5 could have concluded around the 1630, 1380, and 1960 levels, respectively.
SUN PHARMACEUTICALS Elliott Wave Analysis (4H Chart)
SUN PHARMACEUTICALS Technical Chart Analysis
Function: Larger Degree Trend Higher (Intermediate Degree Orange)
Mode: Motive
Structure: Impulse
Position: Minute Wave ((v)) Navy
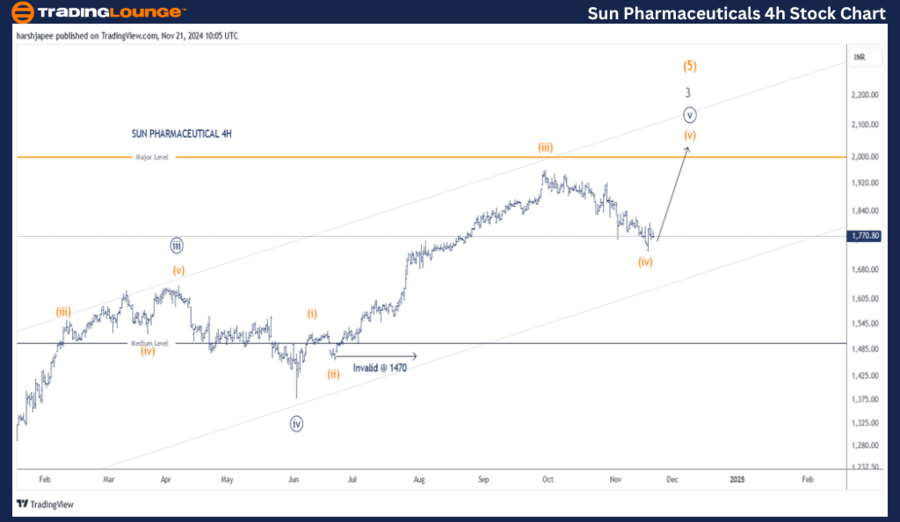
Details: Minute Wave ((v)) of Minor Wave 3 Grey might still be advancing toward the 2000 target. Risk levels have been adjusted to 1470 to accommodate corrective scenarios. Minuette Wave (iv) Orange is likely complete around the 1750 zone, signaling a potential return of bullish momentum. Alternatively, the termination of Minor Waves 3, 4, and 5 as marked may suggest the start of a larger-degree corrective wave.
Invalidation Point: 1470
SUN PHARMACEUTICAL 4H Chart Technical Analysis and Potential Elliott Wave Counts
The 4H chart reflects the development of Minuette degree subwaves following the completion of Minute Wave ((iv)) of Minor Wave 3 near the 1380 level on June 04, 2024. Minuette Wave (iv) Orange appears to have concluded in the 1740-1750 range.
Assuming this wave count is accurate, the stock is expected to resume its rally towards the 2000 level, completing Minuette Wave (v) of Minute Wave ((v)) within Minor Wave 3 Grey.
Technical Analyst: Harsh Japee
Source: visit Tradinglounge.com and learn From the Experts Join TradingLounge Here
Previous: LARSEN & TOUBRO – LT Elliott Wave Technical Analysis
VALUE Offer - Buy 1 Month & Get 3 Months!Click here
Access 7 Analysts Over 200 Markets Covered. Chat Room With Support
Conclusion:
SUN PHARMACEUTICAL is likely advancing toward the 2000 mark, driven by the unfolding of Minute Wave ((v)) within Minor Wave 3 of Intermediate Wave (5). Further upward momentum remains probable as long as the price holds above the critical invalidation level of 1470.