20Jun

Bearish Elliott Wave Forecast for NORTHERN STAR RESOURCES LTD – NST Targets 16.86 with No Bullish Signs

NORTHERN STAR RESOURCES LTD – NST Stock Analysis & Elliott Wave Technical Forecast

Welcome to today's Elliott Wave forecast for Northern Star Resources Ltd (ASX:NST). Our current analysis signals a potential short-term decline, with prices likely heading toward the 16.86 level. At this stage, there are no indicators suggesting a bullish reversal. Our updated wave count maintains a bearish perspective.


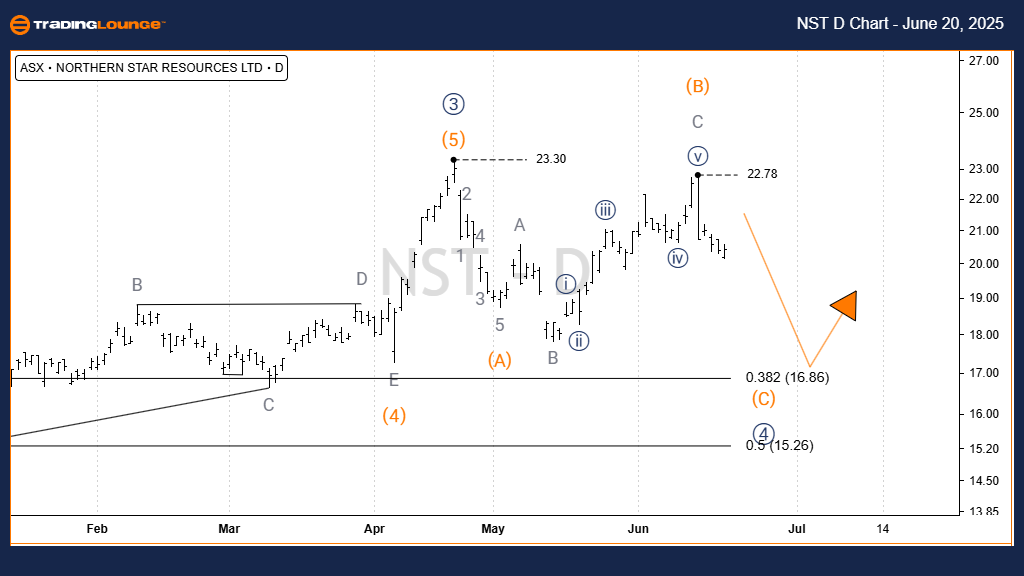
NORTHERN STAR RESOURCES LTD – NST Elliott Wave Technical Analysis | 1D Chart Analysis

Function: Major Trend (Minor Degree – Grey)

Mode: Motive

Structure: Impulse

Position: Wave C)‑orange of Wave 4))‑navy

Details:

The corrective Wave 4))‑navy is evolving as a classic ABC‑orange zigzag pattern.

Waves A) and B)‑orange are already completed.

Currently, Wave C)‑orange is progressing downward, aiming for the 16.86 price level.

Invalidation Point: 23.78

Conclusion: There are no bullish signals. The short-term trend remains bearish.

NST-asx-day-chart-20...


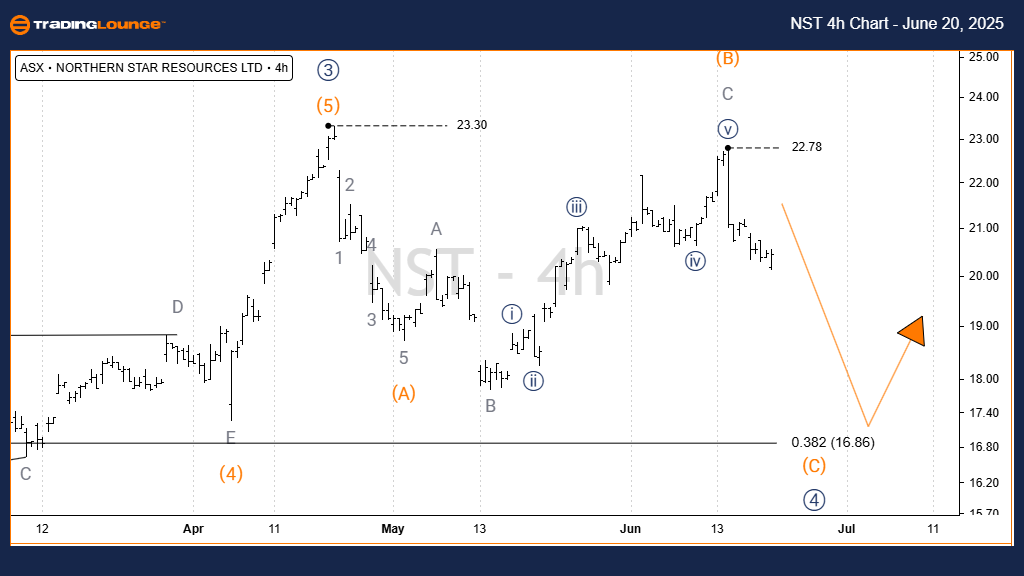
NORTHERN STAR RESOURCES LTD – NST Elliott Wave Technical Analysis | 4‑Hour Chart Analysis

Function: Major Trend (Minor Degree – Grey)

Mode: Motive

Structure: Impulse

Position: Wave C)‑orange of Wave 4))‑navy

Details:

Confirming the 1D view, Wave C)‑orange is extending downward after peaking at 22.78.

The projected downside target is near 16.86.

Invalidation Point: 22.78

Technical Analyst: Hua (Shane) Cuong, CEWA-M (Master’s Designation).

Source: Visit Tradinglounge.com and learn from the Experts. Join TradingLounge Here 

See Previous: NEWMONT CORPORATION - NEM Elliott Wave Technical Analysis

VALUE Offer - $1 for 2 Weeks then $29 a month!Click here

Access 7 Analysts Over 200 Markets Covered. Chat Room With Support

NST-asx-4h-chart-200...


Conclusion
The Elliott Wave model continues to support a bearish short-term outlook for ASX:NST. Key technical levels—16.86 as the downside target and 23.78 as the invalidation threshold—provide traders and investors with clear reference points. This analysis delivers a structured and professional forecast, aimed at helping market participants make informed decisions based on actionable chart signals.

Related

Gold Commodity Price Forecast Using Elliott Wave: 2024 Bullish Trend Points to $3500 Target After Pullback – When to Buy

Gold Commodity Price Forecast Using Elliott Wave: 2024 Bullish Trend Points to $3500 Target After Pullback – When to Buy

Gold remains bullish with Elliott Wave analysis forecasting a rally to $3200–$3500. Discover key le...

Read More >
Amazon Inc.(AMZN) Stocks Elliott Wave Analysis: A Comprehensive Technical Overview

Amazon Inc.(AMZN) Stocks Elliott Wave Analysis: A Comprehensive Technical Overview

This detailed analysis provides an in-depth look into Amazon.com Inc. (AMZN) through the lens of Ell...

Read More >
USDCHF Elliott Wave Technical Analysis Highlighting Navy Blue Wave 2, Orange Wave C, Critical Levels, and Market Dynamics for Traders

USDCHF Elliott Wave Technical Analysis Highlighting Navy Blue Wave 2, Orange Wave C, Critical Levels, and Market Dynamics for Traders

This comprehensive analysis of USDCHF highlights Elliott Wave structures, focusing on Navy Blue Wave...

Read More >
Elliott Wave Insights & Strategies SP500, NASDAQ, DAX 40, FTSE 100, ASX200

Elliott Wave Insights & Strategies SP500, NASDAQ, DAX 40, FTSE 100, ASX200

Elliott Wave Analysis Update: Gain insight into market trends and timing with our analysis of the El...

Read More >
Article provides an in-depth Silver (XAGUSD) Commodity Elliott Wave Technical Analysis

Article provides an in-depth Silver (XAGUSD) Commodity Elliott Wave Technical Analysis

This article provides an in-depth Silver Price Analysis through the lens of Elliott Wave Theory. It ...

Read More >
Highlighting the Future Price Trend of VeChain Cryptocurrency Pair: VETUSD Elliott Wave Technical Analysis

Highlighting the Future Price Trend of VeChain Cryptocurrency Pair: VETUSD Elliott Wave Technical Analysis

This article provides an in-depth Elliott Wave analysis for VeChain (VETUSD), highlighting the curre...

Read More >

$1 for 2 Weeks

then $29 a month!

What a Special Offer!

Trade Recommendations

Unleash the power of deversified trading with our comprehensive portfolio, covering 250+ markets:

  • Stock Trades
  • Crypto Trades
  • Forex Trades
  • Commodity Trades
Elliott Wave Analysis

Gain a competitive edge with expert insights and AI-powered Elliott Wave charting into:

  • Global Indices
  • US Stocks & ASX Stocks
  • Forex & Crypto
  • Commodities
Top-Notch Trading Tools

Equip yourself with the tools of success:

  • Real-time Chat rooms
  • Elliott Wave Algorithm
  • Portfolio tools
  • TradingLevels
  • Screener
  • Trading Game
7 Elliott Wave Analysts

Stay ahead of the market with daily charts and insightful videos
Your secret to strategic trading!

JOIN HERE


Welcome to TradingLounge (ASIC A.R.No. 321187), specialists in trades, trading education and technical analysis, covering stocks, indices, commodities, forex and cryptocurrencies.

When you join TradingLounge you have access to everything we offer, including trade tools, educational content and a social platform to chat with like-minded investors.

Read more

@Copyright 2024 by tradinglounge.com

Contact Us

Australian no: 02 4787 6020

International no: +61 (2) 47876020

Pay with:

Find us on