19Jun

Newmont Corporation Elliott Wave Forecast: ASX:NEM Price Target $100 in Bullish Wave 3 With Key Invalidation at $74.25

ASX: NEWMONT CORPORATION - NEM Elliott Wave Technical Analysis | TradingLounge

Greetings traders,
Today’s updated Elliott Wave forecast focuses on Newmont Corporation (ASX:NEM).

The analysis indicates that ASX:NEM is advancing within an extended third wave. This review outlines the key bullish targets and defines a clear invalidation level to monitor trend continuation or possible reversal.


ASX: NEWMONT CORPORATION - NEM Elliott Wave Technical Analysis | 1D Chart (Semilog Scale)

Function: Primary Trend (Minor degree, grey)

Mode: Motive

Structure: Impulse

Wave Position: Wave iii) - orange of Wave iii)) - navy of Wave 3 - grey

Technical Breakdown:
Wave ii) - orange appears complete near the 74.25 low, forming a classic a-b-c zigzag correction (grey). Since then, Wave iii) - orange has been moving upward, with a projected upside price target near 100.00.

Invalidation Level: 74.25

NEM-D-ASX-chart-1906...


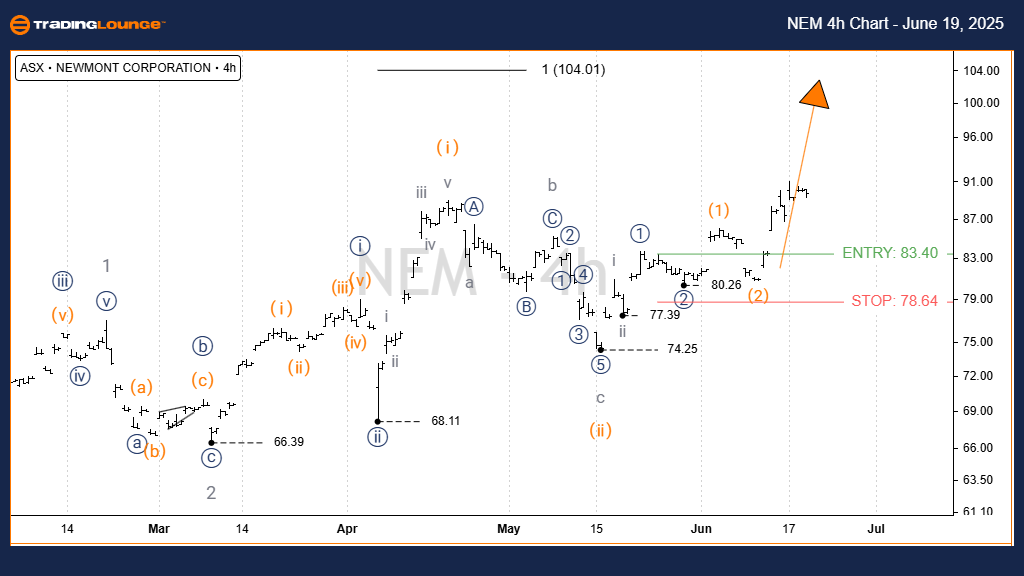
ASX: NEWMONT CORPORATION - NEM Elliott Wave Technical Analysis | TradingLounge (4-Hour Chart)

Function: Primary Trend (Minor degree, grey)

Mode: Motive

Structure: Impulse

Wave Position: Wave iii) - orange of Wave ((iii)) - navy of Wave 3 - grey

Technical Breakdown:
Short-term Elliott Wave structure continues to support the bullish trend seen in the daily timeframe. Wave iii) - orange is currently extending upward with a near-term resistance target around 90.00 and an upper resistance zone approaching 100.00.

Invalidation Level: 74.25

Technical Analyst: Hua (Shane) Cuong, CEWA-M (Master’s Designation).

Source: Visit Tradinglounge.com and learn from the Experts. Join TradingLounge Here 

See Previous: COCHLEAR LIMITED - COH Elliott Wave Technical Analysis

VALUE Offer - $1 for 2 Weeks then $29 a month!Click here

Access 7 Analysts Over 200 Markets Covered. Chat Room With Support

NEM-4h-ASX-chart-190...


Conclusion:
This Elliott Wave analysis of Newmont Corporation (ASX:NEM) provides traders with a comprehensive outlook across both daily and intraday charts. Key Fibonacci levels, bullish price zones, and the established invalidation point allow for enhanced risk management and trading precision. This interpretation aims to maintain a data-focused, unbiased view of the current trend using Elliott Wave Theory.

Related

INSURANCE AUSTRALIA GROUP LIMITED – IAG Stock Analysis & Elliott Wave Technical Forecast Trends, and Market Outlook 2025

INSURANCE AUSTRALIA GROUP LIMITED – IAG Stock Analysis & Elliott Wave Technical Forecast Trends, and Market Outlook 2025

ASX: IAG (Insurance Australia Group Limited) outlines the current market wave structure, forecasts p...

Read More >
FTSE 100 (UK) Index Elliott Wave Technical Analysis: Informed Decisions with Economic Indicators and Chart Analysis

FTSE 100 (UK) Index Elliott Wave Technical Analysis: Informed Decisions with Economic Indicators and Chart Analysis

This article provides comprehensive insights into FTSE 100 trading and UKX analysis, including Ellio...

Read More >
U.S. Dollar / Japanese Yen (USDJPY) Elliott Wave Analysis: Daily & 4-Hour Chart Insights on Corrective Phases and Bullish Trends

U.S. Dollar / Japanese Yen (USDJPY) Elliott Wave Analysis: Daily & 4-Hour Chart Insights on Corrective Phases and Bullish Trends

USDJPY Elliott Wave Analysis offers an in-depth look at the daily and 4-hour charts. The report pred...

Read More >
AMCOR PLC – AMC Elliott Wave Forecast Reveals Bullish Wave 3 Setup with Price Targets, Stock Analysis, and Trading Strategy

AMCOR PLC – AMC Elliott Wave Forecast Reveals Bullish Wave 3 Setup with Price Targets, Stock Analysis, and Trading Strategy

AMCOR PLC (ASX: AMC) uses Elliott Wave Theory to forecast a potential bullish trend. With Wave (2) c...

Read More >
Natural Gas Commodity Elliott Wave Technical Analysis: Market Trends and Strategic Insights

Natural Gas Commodity Elliott Wave Technical Analysis: Market Trends and Strategic Insights

This article provides an in-depth natural gas Elliott Wave analysis, highlighting current bearish tr...

Read More >
Elliott Wave Analysis: Major Indices Poised for Potential Upswings Amid Key Economic Data Releases

Elliott Wave Analysis: Major Indices Poised for Potential Upswings Amid Key Economic Data Releases

S&P 500 (SPX): The Wave ii) low may be established, but confirmation is needed through a completed u...

Read More >

$1 for 2 Weeks

then $29 a month!

What a Special Offer!

Trade Recommendations

Unleash the power of deversified trading with our comprehensive portfolio, covering 250+ markets:

  • Stock Trades
  • Crypto Trades
  • Forex Trades
  • Commodity Trades
Elliott Wave Analysis

Gain a competitive edge with expert insights and AI-powered Elliott Wave charting into:

  • Global Indices
  • US Stocks & ASX Stocks
  • Forex & Crypto
  • Commodities
Top-Notch Trading Tools

Equip yourself with the tools of success:

  • Real-time Chat rooms
  • Elliott Wave Algorithm
  • Portfolio tools
  • TradingLevels
  • Screener
  • Trading Game
7 Elliott Wave Analysts

Stay ahead of the market with daily charts and insightful videos
Your secret to strategic trading!

JOIN HERE


Welcome to TradingLounge (ASIC A.R.No. 321187), specialists in trades, trading education and technical analysis, covering stocks, indices, commodities, forex and cryptocurrencies.

When you join TradingLounge you have access to everything we offer, including trade tools, educational content and a social platform to chat with like-minded investors.

Read more

@Copyright 2024 by tradinglounge.com

Contact Us

Australian no: 02 4787 6020

International no: +61 (2) 47876020

Pay with:

Find us on