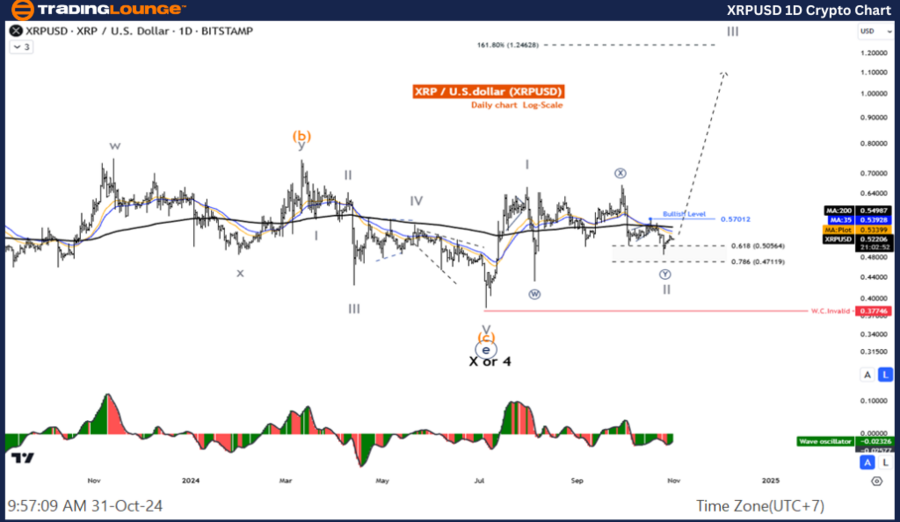
XRPUSD Elliott Wave Analysis – TradingLounge Daily Chart
XRP/USD (XRPUSD) Daily Chart Analysis
XRPUSD Elliott Wave Technical Analysis
Function: Counter-Trend
Mode: Corrective
Structure: Double Corrective
Position: Wave ((Y))
Higher Degree Direction: Wave II of Impulse
Invalidation Level for Wave Cancelation: Pending
Analysis Details: It appears that Wave II has likely reached completion, positioning XRPUSD for a potential upward movement in Wave III.
XRP/USD Trading Strategy:
With the corrective phase of Wave II seemingly completed, our focus shifts toward the anticipated five-wave rally in Wave III. The price remains in an uptrend, indicating a potential opportunity for trend re-entry.
XRP/USD Technical Indicators:

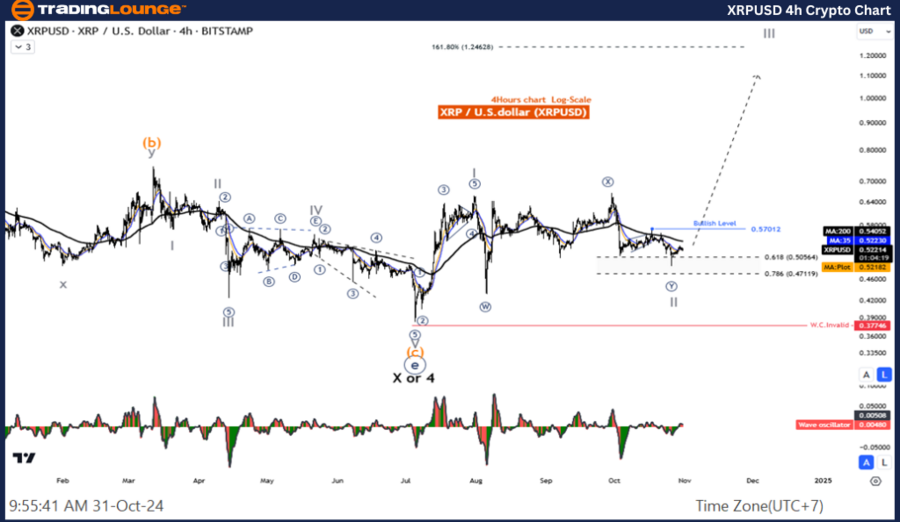
XRPUSD Elliott Wave Analysis – TradingLOunge 4-Hour Chart
XRPUSD Elliott Wave Technical Analysis
Function: Counter-Trend
Mode: Corrective
Structure: Double Corrective
Position: Wave ((Y))
Higher Degree Direction: Wave II of Impulse
Invalidation Level for Wave Cancelation: Pending
Analysis Details: Wave II likely reached its end, implying the beginning of an upward trend in Wave III.
XRP/USD Trading Strategy:
Following the completion of the Wave II correction, we focus on the emerging five-wave rally in Wave III. Price action indicates an uptrend, reinforcing the strategy of seeking re-entry opportunities.
XRP/USD Technical Indicators:
Technical Analyst: Kittiampon Somboonsod
Source: visit Tradinglounge.com and learn From the Experts Join TradingLounge Here See
Previous: DOGEUSD Elliott Wave Technical Analysis
VALUE Offer - Buy 1 Month & Get 3 Months!Click here
Access 7 Analysts Over 200 Markets Covered. Chat Room With Support
