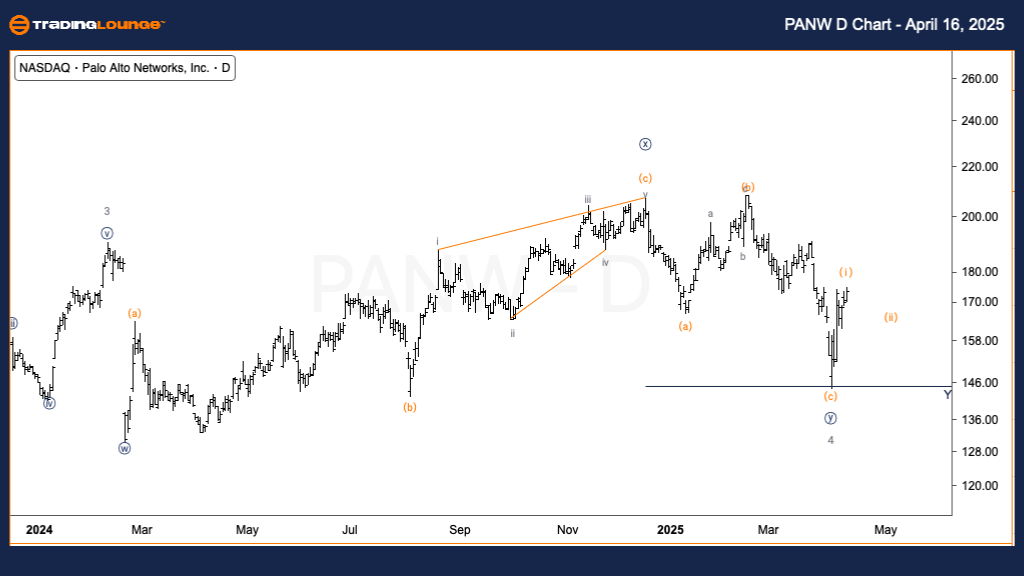
Palo Alto Networks Inc. (PANW) Elliott Wave Analysis – TradingLounge Daily Chart
PANW Elliott Wave Technical Analysis
FUNCTION: Trend
MODE: Motive
STRUCTURE: Impulsive
POSITION: Wave {i} of 5
DIRECTION: Upside in wave 5
DETAILS: Wave 4 may be complete, though confirmation is still pending. The measured equality between corrective waves Y and W points to a potential bullish reversal zone.
Elliott Wave analysis of Palo Alto Networks Inc. (PANW) on the daily chart indicates that wave 4 might be coming to an end. The current price movement aligns with the equality area of waves Y and W, which often marks significant turning points in the market. Although early, this setup hints at the initiation of wave 5 to the upside. If PANW continues forming a clear impulsive pattern upward, it would validate the beginning of a new bullish phase, reinforcing the longer-term uptrend.
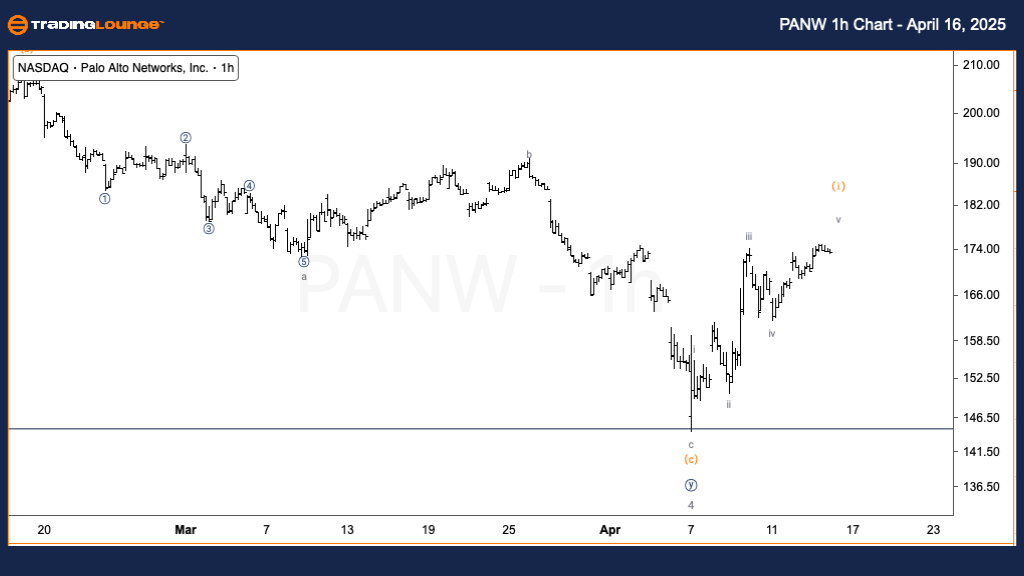
Palo Alto Networks Inc. (PANW) Elliott Wave Analysis – TradingLounge 1H Chart
PANW Elliott Wave Technical Analysis
FUNCTION: Trend
MODE: Motive
STRUCTURE: Impulsive
POSITION: Wave (i) of {i}
DIRECTION: Downside in {i}
DETAILS: The structure of a five-wave decline in wave (i) is developing, suggesting a bullish setup if followed by a corrective wave (ii).
The 1-hour chart of PANW displays the initial stages of a five-wave impulsive move within wave (i), which typically signals a trend change. A completed three-wave correction in wave (ii) would serve as confirmation of a bullish wave {i} in progress. This shorter timeframe view supports the larger daily outlook, pointing toward the start of wave 5 and suggesting further upside potential for Palo Alto Networks stock.
Technical Analyst: Alessio Barretta
Source: Visit Tradinglounge.com and learn from the Experts. Join TradingLounge Here
Previous:Fortinet Inc. (FTNT) Elliott Wave Technical Analysis
VALUE Offer - Buy 1 Month & Get 3 Months!Click here
Access 7 Analysts Over 200 Markets Covered. Chat Room With Support