23Jan

NIFTY 50 (India) Elliott Wave Analysis: Technical Insights, Forecasted Price Movements, and Key Trading Opportunities

NIFTY 50 INDEX Elliott Wave Technical Analysis – Trading Lounge (1D Chart)

NIFTY 50 Elliott Wave Technical Analysis

Function: Counter Trend (Minor degree, Grey)

Mode: Corrective

Structure: Impulse within a larger degree

Position: Minute Wave ((ii))

Analysis Details:
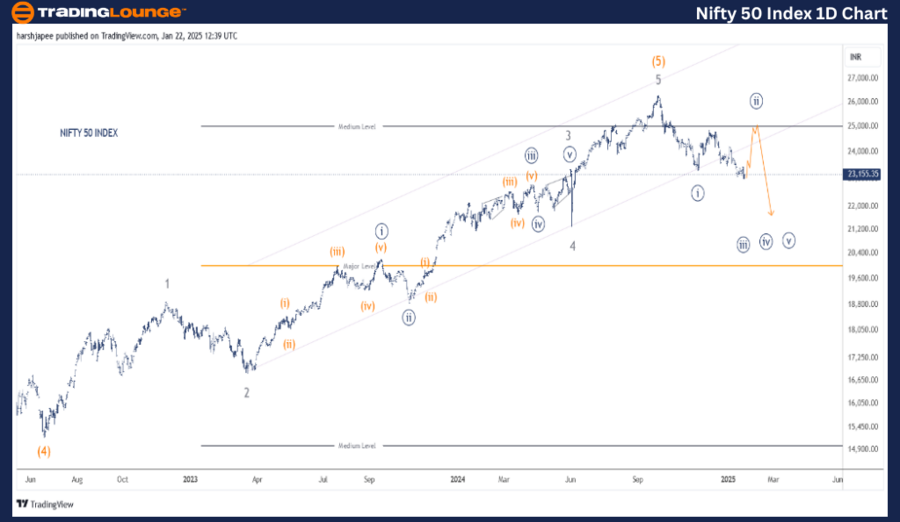
Minute Wave ((ii)) is advancing towards the 25000 range before a potential downward continuation. The ongoing Minuette (a)-(b)-(c) corrective wave may be forming an expanded flat. If this count is valid, Wave (c) is expected to unfold soon. A short position is advisable in the 25000-100 zone.

Invalidation Point: 26400

NIFTY 50 INDEX Daily Chart Analysis & Elliott Wave Outlook

The NIFTY 50 INDEX daily chart indicates a significant top formation around the 26300 level in September 2024. Since then, the index has reversed downward, marking Minute Wave ((i)) around the 23267 zone and progressing in an expanded flat corrective pattern targeting the 25000-100 area.

The market previously completed Intermediate Wave (4) around the 15200 level in June 2022, after which a bullish trend subdivided into five waves (Minor degree) from Wave 1 to Wave 5, culminating at the 26300 mark.

If the current Elliott Wave structure holds, the index is expected to follow a corrective move against the 26300 resistance level, reinforcing a larger-degree correction phase.

NIFTY-50-INDEX-1d-ch...


NIFTY 50 INDEX Elliott Wave Technical Analysis – Trading Lounge (4h Chart)

Function: Counter Trend (Minor degree, Grey)

Mode: Corrective

Structure: Impulse within a larger degree

Position: Minute Wave ((ii))

Analysis Details:
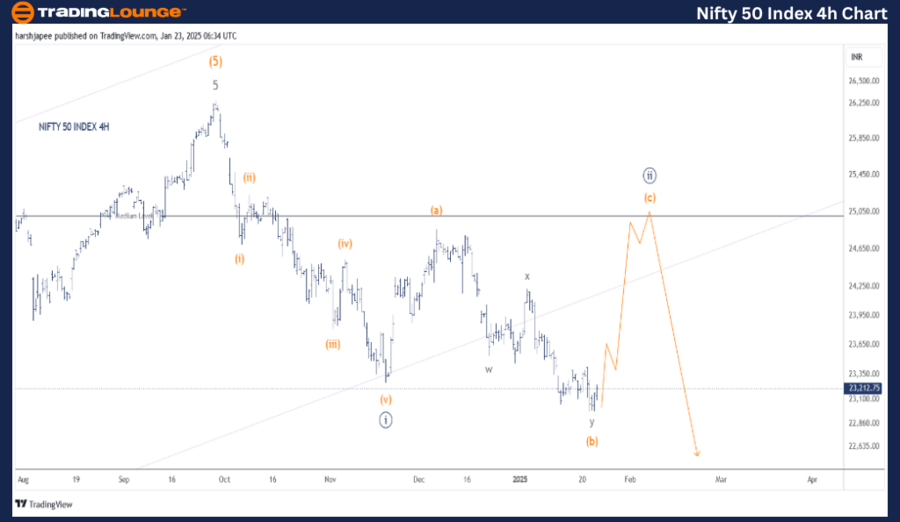
Minute Wave ((ii)) is progressing towards the 25000 level, signaling a continuation of the corrective phase before a resumption of the downward trend. The unfolding Minuette (a)-(b)-(c) pattern suggests an expanded flat structure. If the count is accurate, Wave (c) should push higher soon. Short positions are recommended around the 25000-100 range.

Invalidation Point: 26400

NIFTY 50 INDEX 4H Chart Analysis & Elliott Wave Outlook

The NIFTY 50 INDEX 4H chart illustrates potential wave counts after the index peaked at the 26280-300 range on September 27, 2024. The initial decline to the 23267 low represents an impulse wave at Minuette Degree, labeled (i) to (v) in Orange, concluding Minute Wave ((i)).

Following this impulse, the structure appears to be unfolding as an expanded flat corrective wave (a)-(b)-(c), with an expected push towards the 25000-100 zone. Notably, Wave (b) may have developed as a complex combination w-x-y at the Sub-Minuette level.

If this outlook remains valid, a move toward the 25000-100 target is expected, and confirmation of the bullish scenario would occur with a break above the 23430 resistance level.

Technical Analyst: Harsh Japee

Source: visit Tradinglounge.com and learn From the Experts Join TradingLounge Here 

Previous: IBEX 35 (Spain) Elliott Wave Technical Analysis

VALUE Offer - Buy 1 Month & Get 3 Months!Click here

Access 7 Analysts Over 200 Markets Covered. Chat Room With Support

NIFTY-50-INDEX-4h-ch...


Conclusion:

The NIFTY 50 INDEX is poised to advance towards the 25000-100 zone, completing Minuette Wave (c) in Orange and concluding Minute Wave ((ii)) against the 23000 support zone.

Related

Achieving ASX Trading Success: AMCOR PLC (AMC) Stock Insights and Elliott Wave Technical Analysis

Achieving ASX Trading Success: AMCOR PLC (AMC) Stock Insights and Elliott Wave Technical Analysis

Get an in-depth analysis of AMCOR PLC (AMC) with Elliott Wave insights, ASX stock forecasts, and tra...

Read More >
Shanghai Composite Index Elliott Wave Technical Analysis - SSE Investment Insights and Shanghai Composite trading

Shanghai Composite Index Elliott Wave Technical Analysis - SSE Investment Insights and Shanghai Composite trading

Gain a deep understanding of Shanghai Composite trading with expert Elliott Wave analysis and action...

Read More >
Cocoa Market Forecast 2024: Elliott Wave Technical Analysis, Trends, and Trading Opportunities

Cocoa Market Forecast 2024: Elliott Wave Technical Analysis, Trends, and Trading Opportunities

This analysis delves into the 2024 cocoa market using Elliott Wave theory. It highlights recent pric...

Read More >
Larsen & Toubro Stock Elliott Wave Technical Analysis: Covering Current Trends, Wave Counts, and Potential Price targets

Larsen & Toubro Stock Elliott Wave Technical Analysis: Covering Current Trends, Wave Counts, and Potential Price targets

This analysis provides a comprehensive Elliott Wave review of Larsen & Toubro (LT) stock, covering c...

Read More >
Focusing on Current Trends in the US Dollar / Canadian Dollar Currency Pair: USDCAD Elliott Wave Technical Analysis

Focusing on Current Trends in the US Dollar / Canadian Dollar Currency Pair: USDCAD Elliott Wave Technical Analysis

This article offers a comprehensive USDCAD Elliott Wave analysis, including the latest wave counts, ...

Read More >
NIFTY 50(INDIA) Index Elliott Wave Technical Analysis Provides Detailed Insights into current market trends

NIFTY 50(INDIA) Index Elliott Wave Technical Analysis Provides Detailed Insights into current market trends

The NIFTY 50 (India) Elliott Wave Analysis provides detailed insights into current market trends usi...

Read More >

Buy 1 Month

Get 3 Months!

Special Offer:

Trade Recommendations

Unleash the power of deversified trading with our comprehensive portfolio, covering:

  • Stock Trades
  • Crypto Trades
  • Forex Trades
  • Commodity Trades
Elliott Wave Analysis

Gain a competive edge with expert insights in to:

  • Global Indices
  • US Stocks & ASX Stocks
  • Forex & Crypto
  • Commodities
Top-Notch Trading Tools

Equip yourself with the tools of success:

  • Social Chat
  • Elliott Wave Algorithm
  • Screener
  • TradingLevels
  • Trading Game
7 Elliott Wave Analysts

Stay ahead of the market with daily charts and insightful videos
-Your secret to strategic trading!

JOIN HERE


Welcome to TradingLounge (ASIC A.R.No. 321187), specialists in trades, trading education and technical analysis, covering stocks, indices, commodities, forex and cryptocurrencies.

When you join TradingLounge you have access to everything we offer, including trade tools, educational content and a social platform to chat with like-minded investors.

Read more

@Copyright 2024 by tradinglounge.com

Contact Us

Australian no: 02 4787 6020

International no: +61 (2) 47876020

Pay with:

Find us on