IBEX 35 (Spain) Elliott Wave Analysis – Trading Lounge Day Chart
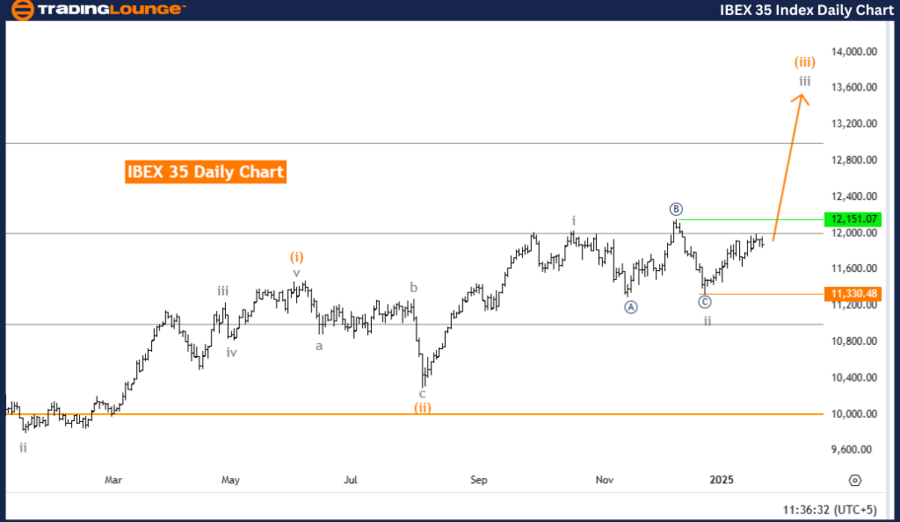
IBEX 35 (Spain) Elliott Wave Technical Analysis
Function: Bullish Trend
Mode: Impulsive
Structure: Gray Wave 3
Position: Orange Wave 3
Direction Next Higher Degrees: Gray Wave 3 (started)
Details: Gray Wave 2 appears completed; Gray Wave 3 of Orange Wave 3 is currently unfolding.
Wave Cancel Invalidation Level: 11,330.48
The IBEX 35 daily chart analysis, based on Elliott Wave Theory, highlights a bullish trend with an impulsive structure. The focus is on the development of Gray Wave 3, which has commenced following the completion of Gray Wave 2. This progression indicates a continued upward trend in the market, confirming bullish momentum.
Currently, the index is positioned within Orange Wave 3, which is a subwave of the larger Gray Wave 3 structure. The ongoing formation of Orange Wave 3 further supports the bullish outlook and suggests a sustained upward trajectory. As long as the price remains above the invalidation level of 11,330.48, the bullish scenario remains intact. A breach below this level would invalidate the current wave structure, prompting a reassessment of market conditions.
Conclusion
The IBEX 35 daily chart presents a strong bullish outlook supported by the continuation of Gray Wave 3. The successful completion of Gray Wave 2 has set the stage for Orange Wave 3 to drive upward momentum within the broader Elliott Wave framework.
Traders should closely monitor the 11,330.48 invalidation level, as it serves as a critical benchmark for assessing the validity of the current wave structure and managing risk effectively. This analysis provides actionable insights to help traders align their strategies with prevailing market trends while remaining cautious of potential reversal signals.

IBEX 35 (Spain) Elliott Wave Analysis – Trading Lounge Weekly Chart
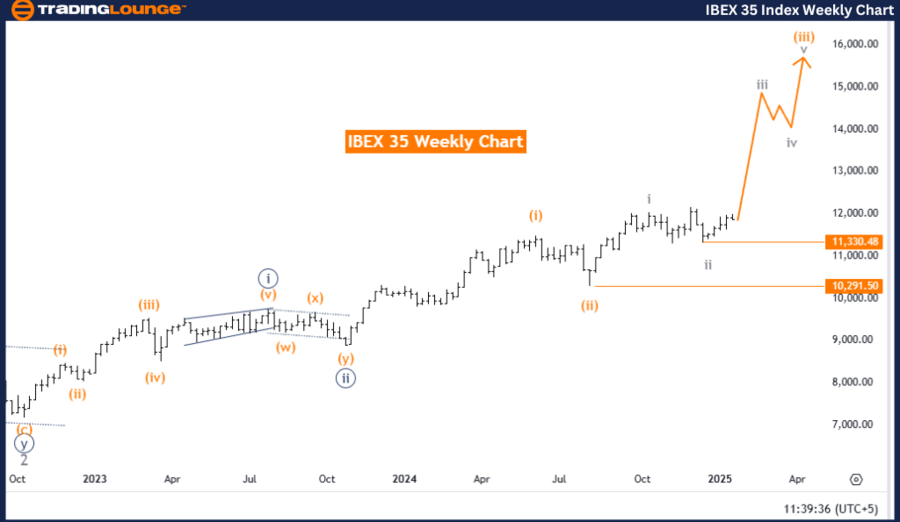
IBEX 35 (Spain) Elliott Wave Technical Analysis
Function: Bullish Trend
Mode: Impulsive
Structure: Gray Wave 3
Position: Orange Wave 3
Direction Next Lower Degrees: Gray Wave 4
Details: Gray Wave 2 appears completed; Gray Wave 3 of Orange Wave 3 is currently in progress.
Wave Cancel Invalidation Level: 11,330.48
The weekly analysis of the IBEX 35 index using Elliott Wave Theory indicates a bullish trend characterized by impulsive price action. Gray Wave 3 has started following the completion of Gray Wave 2, signaling the continuation of the upward trend.
At present, the index is within Orange Wave 3, which contributes to the broader structure of Gray Wave 3. The progression of Orange Wave 3 reinforces bullish sentiment and suggests further upward movement. Upon the completion of Gray Wave 3, a corrective phase in the form of Gray Wave 4 is expected, which could provide temporary consolidation before the trend resumes.
The 11,330.48 invalidation level remains a crucial threshold to watch. A drop below this level would call for a reevaluation of the current Elliott Wave count and could imply a shift in market dynamics.
Conclusion
The IBEX 35 weekly chart analysis reflects a strong bullish sentiment backed by the ongoing development of Gray Wave 3. The continuous growth of Orange Wave 3 solidifies the upward trend, and traders should anticipate potential corrective movements with the emergence of Gray Wave 4.
Monitoring the 11,330.48 invalidation level is essential for risk management and adjusting trading strategies accordingly. This Elliott Wave analysis provides valuable insights to traders seeking to capitalize on market momentum while being prepared for potential corrective scenarios.
Technical Analyst: Malik Awais
Source: visit Tradinglounge.com and learn From the Experts Join TradingLounge Here
Previous: TASI Index Elliott Wave Technical Analysis
VALUE Offer - Buy 1 Month & Get 3 Months!Click here
Access 7 Analysts Over 200 Markets Covered. Chat Room With Support
