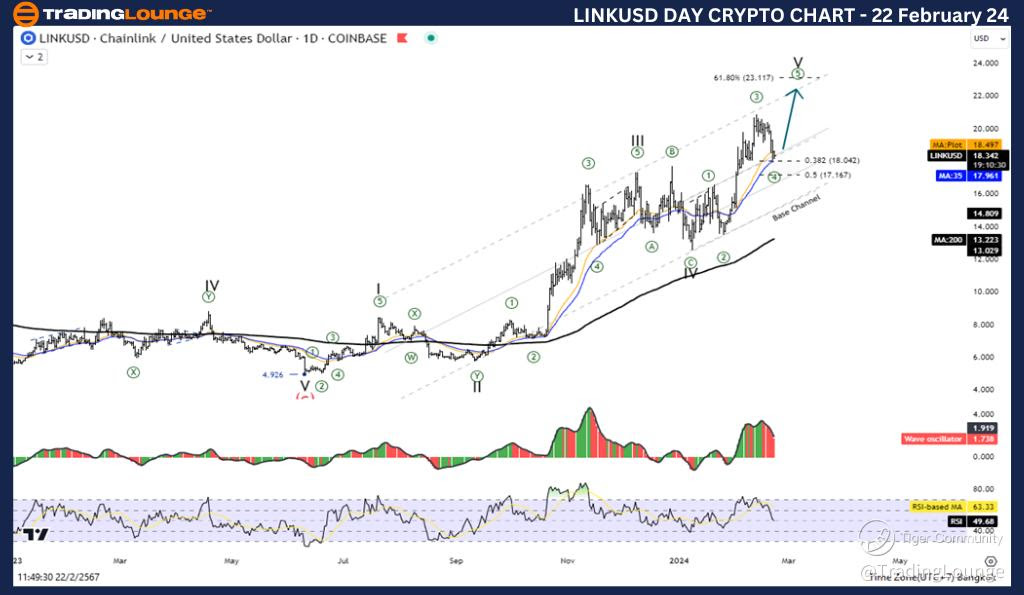
Elliott Wave Analysis TradingLounge Daily Chart, 22 February 24,
Greetings fellow traders, today we delve into the intricate dance of the ChainLink/U.S. Dollar (LINKUSD) pairing through the lens of Elliott Wave Theory. Let's embark on this journey of wave patterns and market sentiment.
ChainLink/ U.S. dollar: Daily Chart Analysis
LINKUSD Elliott Wave Technical Analysis
Function: Follow Trend
Mode: Motive
Structure: Impulse
Position: Wave V
Direction Next Higher Degrees: Wave (I) of Impulse
Wave Cancel Invalid Level: 8.498
Details: Wave V, the focal point of our analysis, aligns harmoniously with the 61.8% retracement level of the wave journey from Wave I through Wave III, gracefully landing at 23.117.
LINKUSD Trading Strategy:
Our discerning eye catches the subtle cues of the market symphony. The crescendo in wave ((3)) hints at an imminent interlude, signaling the impending correction in wave ((5)). As we stand at the apex of this increase, it behooves us to remain vigilant, anticipating the forthcoming correction with poised anticipation.
LINKUSD Technical Indicators:
The price trajectory gracefully ascends above the MA200 threshold, painting a portrait of an undeniable uptrend. Wave oscillators echo this sentiment with a resounding bullish momentum, further affirming the prevailing market direction.

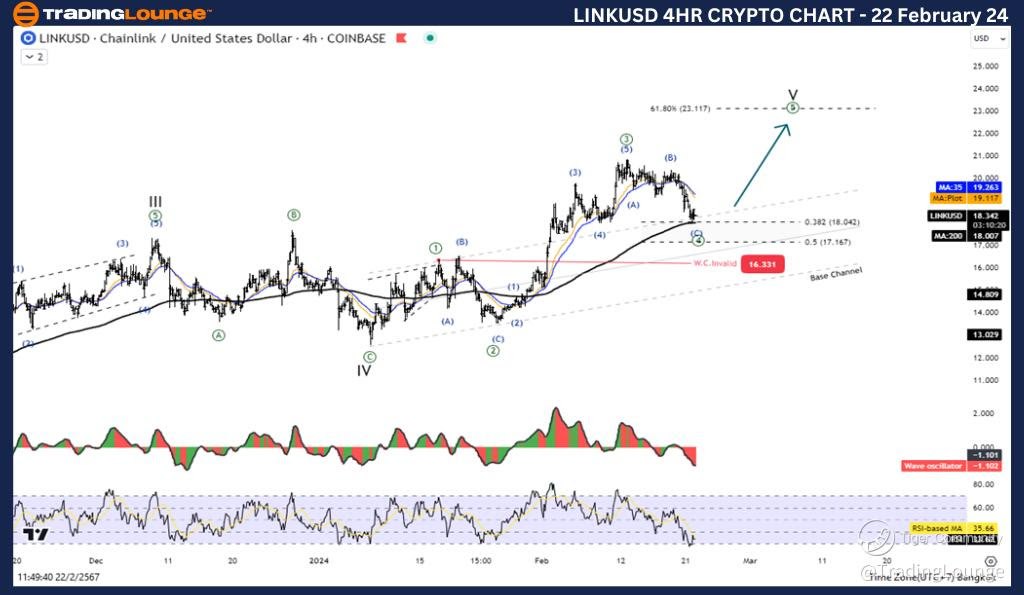
Elliott Wave Analysis TradingLounge 4Hr Chart, 22 February 24,
ChainLink/ U.S. dollar: 4-Hour Chart Analysis
LINKUSD Elliott Wave Technical Analysis
Function: Follow Trend
Mode: Motive
Structure: Impulse
Position: Wave V
Direction Next Higher Degrees: Wave (I) of Impulse
Wave Cancel Invalid Level: 8.498
Details: Mirroring the grandeur of its daily counterpart, Wave V adorns the 4-hour chart, a testament to the fractal nature of market movements. The 61.8% Fibonacci extension from Wave I through Wave III echoes its presence, anchoring the current wave dynamics at 23.117.
ChainLink/ U.S. dollar Trading Strategy:
Our strategic outlook remains unwavering, guided by the principles of Elliott Wave Theory. As wave ((3)) gracefully concludes its ascent, we brace ourselves for the inevitable correction embodied by wave ((5)). The denouement of this wave sequence draws nigh, urging us to maintain a watchful stance as we navigate the shifting currents of market sentiment.
ChainLink/ U.S. dollar Technical Indicators:
Once again, the MA200 serves as a steadfast beacon, guiding our path amidst the market tumult. Its presence above the price action reaffirms the prevailing uptrend, instilling confidence in our trading endeavors. Furthermore, wave oscillators echo this sentiment with their bullish oscillations, underscoring the underlying strength of the market momentum.
TradingLounge Analyst: Kittiampon Somboonsod, CEWA
Source: visit Tradinglounge.com and learn From the Experts Join TradingLounge Here
See Previous: Bitcoin/ U.S. dollar(BTCUSD)

In conclusion, as we traverse the labyrinthine corridors of the financial markets, armed with the illuminating insights of Elliott Wave Theory, let us tread with caution yet confidence. Within the ebb and flow of market dynamics lies the opportunity to decipher the cryptic language of price action and chart a course toward profitable horizons.