04Dec

Palo Alto Networks (PANW) Stock Analysis: Elliott Wave Insights, Bullish Trends, Price Predictions, Wave Counts, and Trading Tips

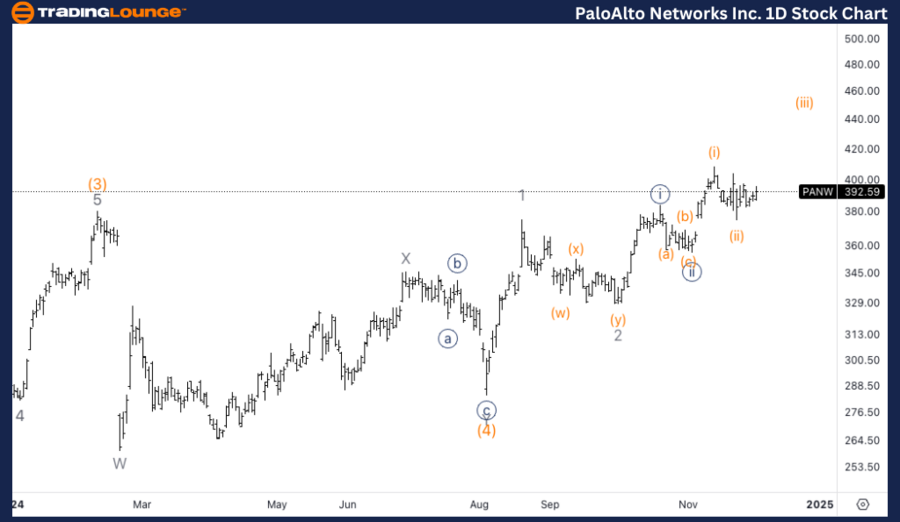
Palo Alto Networks Inc., (PANW)Elliott Wave Analysis Trading Lounge Daily Chart

PANW Elliott Wave Technical Analysis

Function: Trend

Mode: Impulsive

Structure: Motive

Position: Minute {iii}

Direction: Upside within {iii} of 3

Details: We anticipate further upside into wave (5), having completed a large wave 2. The stock appears to be nesting within a series of ones and twos, signaling the early stages of wave 3 development.

PANW Elliott Wave Technical Analysis – Daily Chart

PANW is currently in Minute wave {iii} of an impulsive wave 3, with further upside movement expected. Following the completion of a large wave 2, the stock seems to have nested in a series of ones and twos, characteristic of the early stages of wave 3. This indicates that a significant upward move is on the horizon as wave (5) develops. The impulsive structure suggests sustained bullish momentum, aligning with the broader upward trend.

PaloAlto-Networks-In...


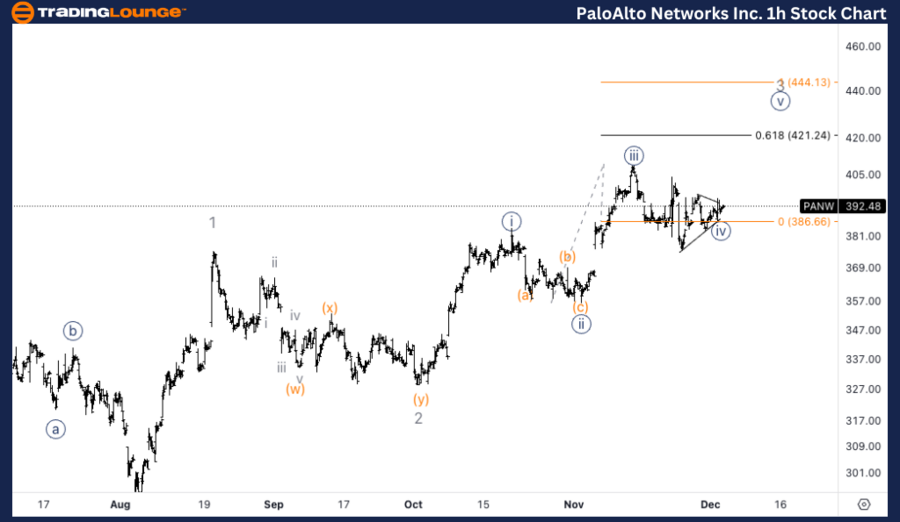
Palo Alto Networks Inc., (PANW) Elliott Wave Analysis Trading Lounge 1H Chart

PANW Elliott Wave Technical Analysis

Function: Trend

Mode: Impulsive

Structure: Motive

Position: Wave {iv} of 3

Direction: Upside in wave {v}

Details: An alternate perspective suggests the possibility of a triangle formation in wave {iv}, preceding an upward move into wave {v} of 3. However, wave {v} must remain shorter than wave {iii}, setting an upper limit of $444.

PANW Elliott Wave Technical Analysis – 1H Chart

On the 1-hour chart, PANW appears to be in wave {iv} of 3. An alternate scenario proposes a triangle formation in wave {iv}, signaling consolidation before the next upward movement into wave {v} of 3. To adhere to the proportionality rules of the Elliott Wave framework, wave {v} must not exceed wave {iii}, capping the upside target at $444. This setup indicates a continuation of the bullish trend after a brief period of consolidation.

Technical Analyst: Alessio Barretta

Source: visit Tradinglounge.com and learn From the Experts Join TradingLounge Here 

See Previous: NFLX Elliott Wave Technical Analysis 

VALUE Offer - Buy 1 Month & Get 3 Months!Click here

Access 7 Analysts Over 200 Markets Covered. Chat Room With Support

PaloAlto-Networks-In...

Related

Spotify Technology S.A. (SPOT) Stock Forecast Using Elliott Wave Analysis: Technical Chart Outlook, and Price Target Toward $800

Spotify Technology S.A. (SPOT) Stock Forecast Using Elliott Wave Analysis: Technical Chart Outlook, and Price Target Toward $800

Spotify Technology S.A. (SPOT) applies Elliott Wave Theory to both daily and intraday 1-hour charts....

Read More >
S&P/ASX 200 Index Elliott Wave Technical Analysis: XJO Trends, Forecasts, and Investment Strategies

S&P/ASX 200 Index Elliott Wave Technical Analysis: XJO Trends, Forecasts, and Investment Strategies

Discover expert insights on S&P/ASX 200 trading and investing with in-depth Elliott Wave analysis, X...

Read More >
Elliott Wave Analysis: Uncover Trading Strategies on S&P 500, NASDAQ 100, DAX 40, FTSE 100 & ASX 200

Elliott Wave Analysis: Uncover Trading Strategies on S&P 500, NASDAQ 100, DAX 40, FTSE 100 & ASX 200

Our latest blog post delves into Elliott Wave analysis on major indices like the S&P 500, NASDAQ 100...

Read More >
Gold XAUUSD Commodity Elliott Wave Technical Analysis:Assessing the Current Trend and Structure

Gold XAUUSD Commodity Elliott Wave Technical Analysis:Assessing the Current Trend and Structure

Gold Elliott Wave Analysis, identifying the crucial stages of the current impulse wave sequence and ...

Read More >
JP Morgan Stock Analysis: Elliott Wave Insights, Price Targets, Daily and Hourly Chart Breakdown, and Trading Strategies

JP Morgan Stock Analysis: Elliott Wave Insights, Price Targets, Daily and Hourly Chart Breakdown, and Trading Strategies

This comprehensive analysis of JP Morgan & Chase Co. explores the stock's Elliott Wave patterns,...

Read More >
TASI Index Elliott Wave Analysis: Daily & Weekly Market Forecast, Impulsive & Corrective Wave Patterns

TASI Index Elliott Wave Analysis: Daily & Weekly Market Forecast, Impulsive & Corrective Wave Patterns

Elliott Wave Analysis of the TASI Index provides a structured approach to understanding market trend...

Read More >

$1 for 2 Weeks

then $29 a month!

What a Special Offer!

Trade Recommendations

Unleash the power of deversified trading with our comprehensive portfolio, covering 250+ markets:

  • Stock Trades
  • Crypto Trades
  • Forex Trades
  • Commodity Trades
Elliott Wave Analysis

Gain a competitive edge with expert insights and AI-powered Elliott Wave charting into:

  • Global Indices
  • US Stocks & ASX Stocks
  • Forex & Crypto
  • Commodities
Top-Notch Trading Tools

Equip yourself with the tools of success:

  • Real-time Chat rooms
  • Elliott Wave Algorithm
  • Portfolio tools
  • TradingLevels
  • Screener
  • Trading Game
7 Elliott Wave Analysts

Stay ahead of the market with daily charts and insightful videos
Your secret to strategic trading!

JOIN HERE


Welcome to TradingLounge (ASIC A.R.No. 321187), specialists in trades, trading education and technical analysis, covering stocks, indices, commodities, forex and cryptocurrencies.

When you join TradingLounge you have access to everything we offer, including trade tools, educational content and a social platform to chat with like-minded investors.

Read more

@Copyright 2024 by tradinglounge.com

Contact Us

Australian no: 02 4787 6020

International no: +61 (2) 47876020

Pay with:

Find us on