12May

ADANI ENTERPRISES Share Price: Elliott Wave Forecast Reveals Bearish Wave C Nearing Completion and Wave 5 on Horizon

Ranjeet | 12 May, 2025 | Indian Stocks | 0 Comments | Return|

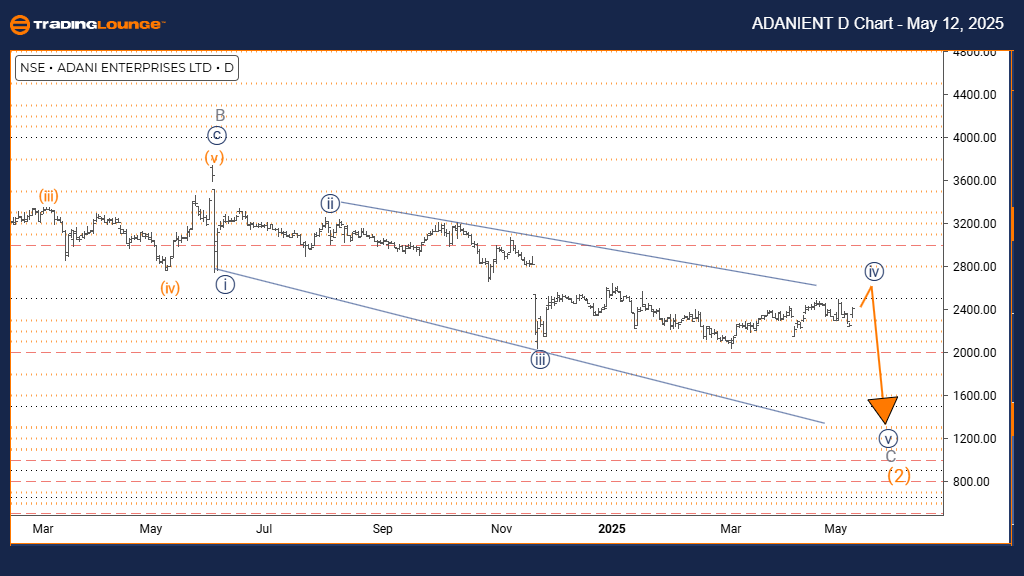
ADANI ENTERPRISES – Elliott Wave Analysis – Trading Lounge Day Chart

ADANIENT Elliott Wave Technical Analysis

FUNCTION: Counter Trend

MODE: Corrective

STRUCTURE: Navy Blue Wave 4

POSITION: Gray Wave C

DIRECTION NEXT LOWER DEGREES: Navy Blue Wave 5

DETAILS: Navy Blue Wave 3 of C is complete; Navy Blue Wave 4 of C is in progress and nearing its conclusion.

The daily Elliott Wave analysis of Adani Enterprises share price reveals a counter-trend correction, forming within a larger bearish setup. The price action currently develops as Navy Blue Wave 4 under Gray Wave C, indicating the stock is approaching the end of its corrective structure. The prior Navy Blue Wave 3 seems completed, while the market now unfolds in Wave 4, typically characterized by consolidation or mild upside before the next downward impulse.

Located within Gray Wave C, this structure signals the final segment of a broader corrective cycle. The next move is likely Navy Blue Wave 5, which may wrap up the current bearish phase. Since Wave 4 is corrective, any upward movement is expected to remain limited. Traders should stay alert for early signals of trend reversal, suggesting that Wave 5 may soon initiate. This technical analysis provides clarity on the short-term positioning of Adani stock and supports a continued bearish outlook, with potential opportunities emerging as Wave 4 concludes.

ADANIENT-d-chart-120...


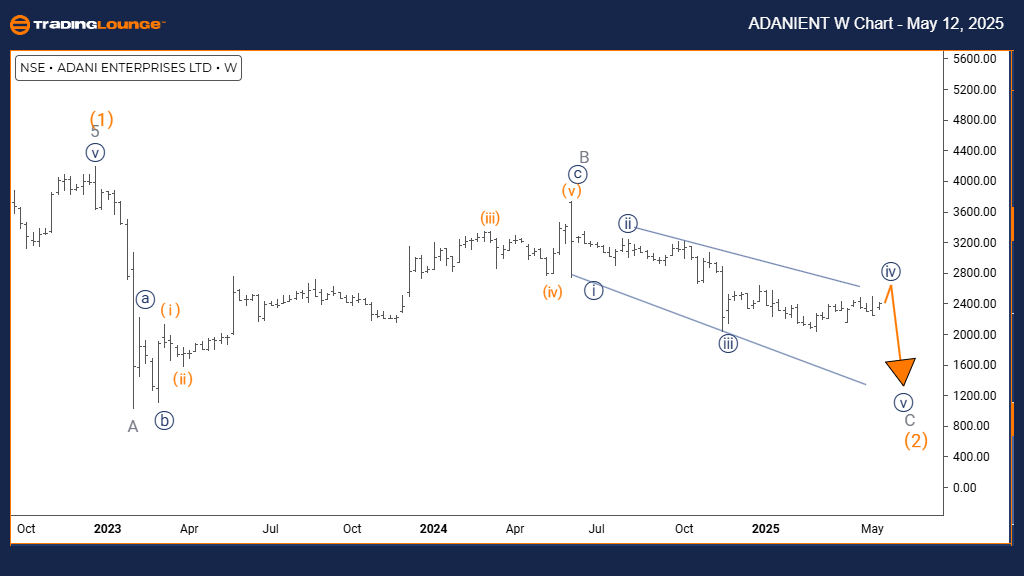
ADANI ENTERPRISES – Elliott Wave Analysis – Trading Lounge Weekly Chart

ADANIENT Elliott Wave Technical Analysis

FUNCTION: Counter Trend

MODE: Impulsive

STRUCTURE: Gray Wave C

POSITION: Orange Wave 2

DIRECTION NEXT HIGHER DEGREES: Orange Wave 3

DETAILS: Gray Wave B is confirmed complete; Gray Wave C is actively progressing.

The weekly Elliott Wave chart for Adani Enterprises stock illustrates a counter-trend setup transitioning into an impulsive phase within a broader corrective wave. The structure reflects Gray Wave C as part of Orange Wave 2, signifying an extended corrective movement. With Gray Wave B finalized, the current active wave—Gray Wave C—is unfolding and may represent the terminal leg of the downtrend.

This impulsive nature of Gray Wave C indicates increased bearish momentum, consistent with late-stage correction dynamics. Upon its completion, Orange Wave 3 is expected to emerge, potentially marking the start of a longer-term bullish move. Confirmation that Wave B has ended reinforces this perspective. Traders should monitor price developments to catch signs of exhaustion in Wave C, which may offer attractive reversal setups.

The Adani Enterprises technical analysis signals the market nearing a potential turning point. Although downside appears limited, confirmation through price action and indicators is essential. The current pattern is critical for assessing long-term positioning and identifying high-probability entry points based on Elliott Wave principles.

Technical Analyst: Malik Awais

Source: Visit Tradinglounge.com and learn from the Experts. Join TradingLounge Here 

Previous: ADANI GREEN Elliott Wave Technical Analysis

VALUE Offer - Buy 1 Month & Get 3 Months!Click here

Access 7 Analysts Over 200 Markets Covered. Chat Room With Support

ADANIENT-w-chart-120...

Related

Newmont Corporation (ASX:NEM) Elliott Wave Analysis Reveals Bullish Wave 3 Progression with $100 Target and Key Price Levels

Newmont Corporation (ASX:NEM) Elliott Wave Analysis Reveals Bullish Wave 3 Progression with $100 Target and Key Price Levels

This analysis provides an in-depth Elliott Wave forecast for Newmont Corporation (ASX:NEM), highligh...

Read More >
Elliott Wave Outlook 28 Apr 2025: SP500, NDX, Big Tech & BTC Trading Strategies

Elliott Wave Outlook 28 Apr 2025: SP500, NDX, Big Tech & BTC Trading Strategies

Tech-led U-S indices and Bitcoin remain in impulsive uptrends, with most charts advancing into Wave-...

Read More >
ASX: SCG (Scentre Group) Elliott Wave Analysis and Stock Forecast Report Covers Key Price Levels and Trading Strategies

ASX: SCG (Scentre Group) Elliott Wave Analysis and Stock Forecast Report Covers Key Price Levels and Trading Strategies

Discover the latest ASX: SCG (Scentre Group) insights with our Elliott Wave technical analysis. This...

Read More >
The Coca-Cola Company (KO) - Stocks Analysis, Elliott Wave Technical Forecast & Price Prediction

The Coca-Cola Company (KO) - Stocks Analysis, Elliott Wave Technical Forecast & Price Prediction

Dive into the dynamic world of Coca-Cola's (KO) stock with our expert analysis guided by Elliott...

Read More >
Silver Price Predictions and Trading Insights to Optimize Your Market Strategy: Silver (XAGUSD) Commodity Elliott Wave Analysis

Silver Price Predictions and Trading Insights to Optimize Your Market Strategy: Silver (XAGUSD) Commodity Elliott Wave Analysis

Silver prices have rebounded from their December 2024 low, signalling a potential continuation of th...

Read More >

$1 for 2 Weeks

then $29 a month!

What a Special Offer!

Trade Recommendations

Unleash the power of deversified trading with our comprehensive portfolio, covering 250+ markets:

  • Stock Trades
  • Crypto Trades
  • Forex Trades
  • Commodity Trades
Elliott Wave Analysis

Gain a competitive edge with expert insights and AI-powered Elliott Wave charting into:

  • Global Indices
  • US Stocks & ASX Stocks
  • Forex & Crypto
  • Commodities
Top-Notch Trading Tools

Equip yourself with the tools of success:

  • Real-time Chat rooms
  • Elliott Wave Algorithm
  • Portfolio tools
  • TradingLevels
  • Screener
  • Trading Game
7 Elliott Wave Analysts

Stay ahead of the market with daily charts and insightful videos
Your secret to strategic trading!

JOIN HERE


Welcome to TradingLounge (ASIC A.R.No. 321187), specialists in trades, trading education and technical analysis, covering stocks, indices, commodities, forex and cryptocurrencies.

When you join TradingLounge you have access to everything we offer, including trade tools, educational content and a social platform to chat with like-minded investors.

Read more

@Copyright 2024 by tradinglounge.com

Contact Us

Australian no: 02 4787 6020

International no: +61 (2) 47876020

Pay with:

Find us on