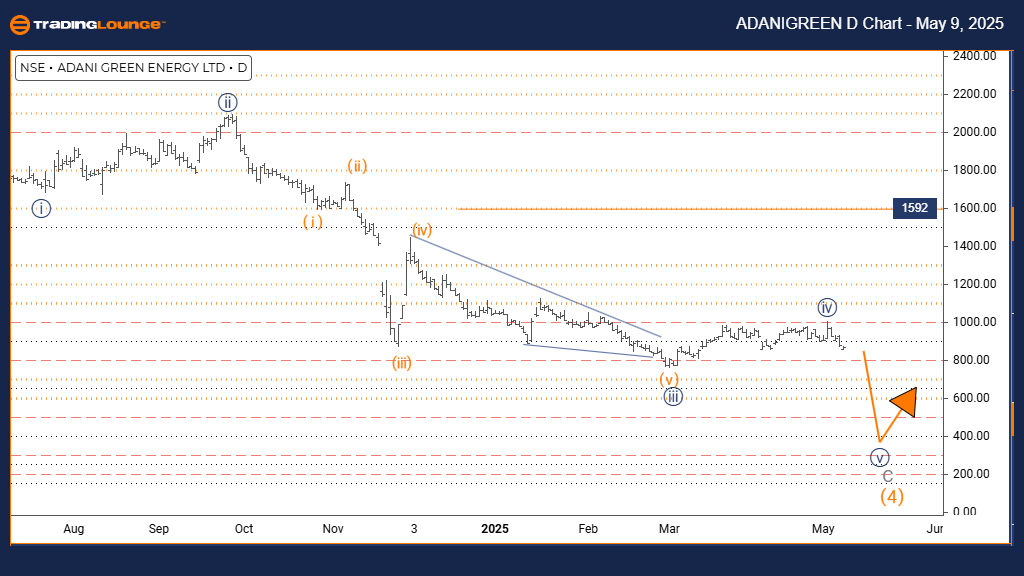
ADANI GREEN Elliott Wave Analysis - Trading Lounge Day Chart Daily Chart
ADANIGREEN Elliott Wave Technical Analysis
FUNCTION: Counter-Trend Movement
MODE: Impulsive Wave Pattern
STRUCTURE: Wave 5 in Navy Blue Sequence
POSITION: Wave C in Gray Sequence
NEXT DIRECTION (LOWER DEGREES): Development of Navy Blue Wave 5
DETAILS: Completion of Navy Blue Wave 4 confirmed; current action progressing within Wave 5 of C
WAVE CANCEL/INVALID LEVEL: 1592
Daily Chart Market Analysis & Elliott Wave Forecast
The Elliott Wave daily analysis for Adani Green Energy stock signals a counter-trend setup within an extended corrective pattern. The current movement continues within Wave 5 of Gray Wave C, suggesting the final leg of this downward sequence is underway.
With Wave 4 of the navy blue degree complete, the structure now shows impulsive characteristics as Wave 5 accelerates lower. This downward leg reflects strong bearish momentum, aligning with the expected completion phase of the corrective structure.
Wave Completion Implications & Risk Management
Wave 5 likely represents the last decline in the current corrective trend. Traders should watch for potential trend reversal indicators—like momentum divergence or weakening downside pressure.
The key invalidation level stands at 1592. A price move above this point would invalidate the existing wave count and require reassessment of the market's Elliott Wave structure.
Trading Strategy Insights & Technical Roadmap
This scenario outlines a structured Elliott Wave forecast where Wave 5 completion could precede a bullish reversal. Observing price behavior at key levels could highlight low-risk entry zones, especially if signals of the corrective phase's end become visible.
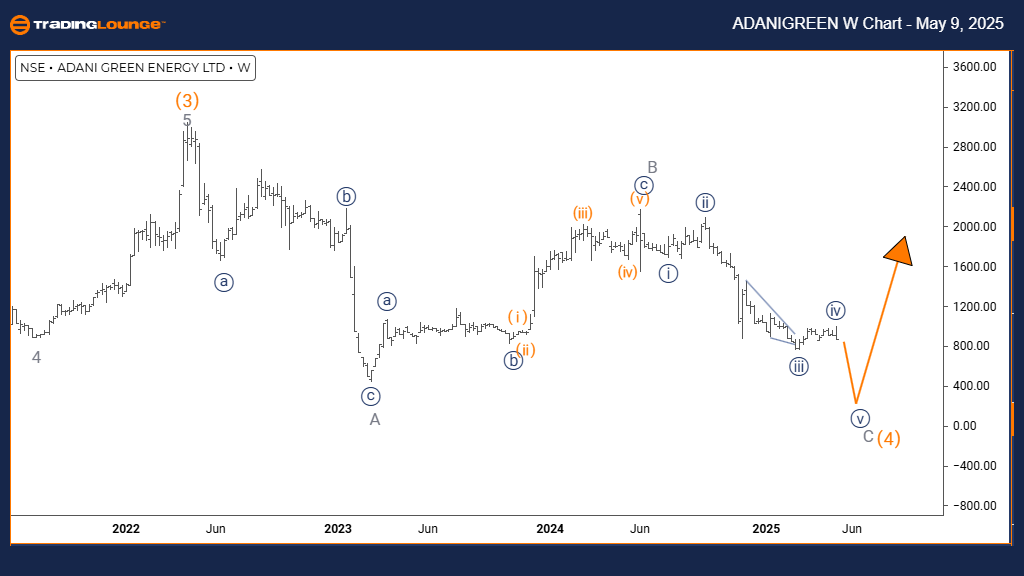
ADANI GREEN Elliott Wave Analysis - Trading Lounge Day Chart Weekly Chart
ADANIGREEN Elliott Wave Technical Analysis
FUNCTION: Counter-Trend Setup
MODE: Impulsive Wave Structure
STRUCTURE: Gray Wave C in Progress
POSITION: Orange Wave 4 Underway
NEXT DIRECTION (HIGHER DEGREES): Formation of Orange Wave 5
DETAILS: Gray Wave B likely completed; Gray Wave C unfolding with impulsive traits
Weekly Elliott Wave Market Overview
In the weekly timeframe, Adani Green Energy’s stock appears in a counter-trend correction, actively developing Gray Wave C within the broader Orange Wave 4. The impulsive structure of Wave C suggests increasing selling strength as this segment unfolds.
The earlier completion of Gray Wave B transitions the chart into the concluding part of the correction, with further downside movement expected before trend reversal signs emerge.
Forecast Implications & Technical Watch Points
Wave C’s impulsiveness supports the idea of a final push lower before transitioning into Orange Wave 5, which could begin a new upward trend. Traders should watch closely for technical signs of pattern exhaustion, including divergence or a slowdown in downward momentum.
Actionable Trading Guidance
The current wave progression indicates a nearing completion of the corrective phase. Monitoring price activity at key support levels will help traders anticipate a trend reversal. This weekly analysis offers a strategic blueprint for preparing for potential bullish phases after Gray Wave C concludes.
Technical Analyst: Malik Awais
Source: Visit Tradinglounge.com and learn from the Experts. Join TradingLounge Here
Previous: ltratech Cement Elliott Wave Technical Analysis
VALUE Offer - Buy 1 Month & Get 3 Months!Click here
Access 7 Analysts Over 200 Markets Covered. Chat Room With Support