Ultratech Cement Elliott Wave Analysis - Trading Lounge Day Chart
Ultratech Cement Day Chart Analysis
Ultratech Cement Elliott Wave Technical Analysis
FUNCTION: Counter Trend
MODE: Corrective
STRUCTURE: Navy Blue Wave 2
POSITION: Gray Wave 5
DIRECTION NEXT HIGHER DEGREES: Navy Blue Wave 3
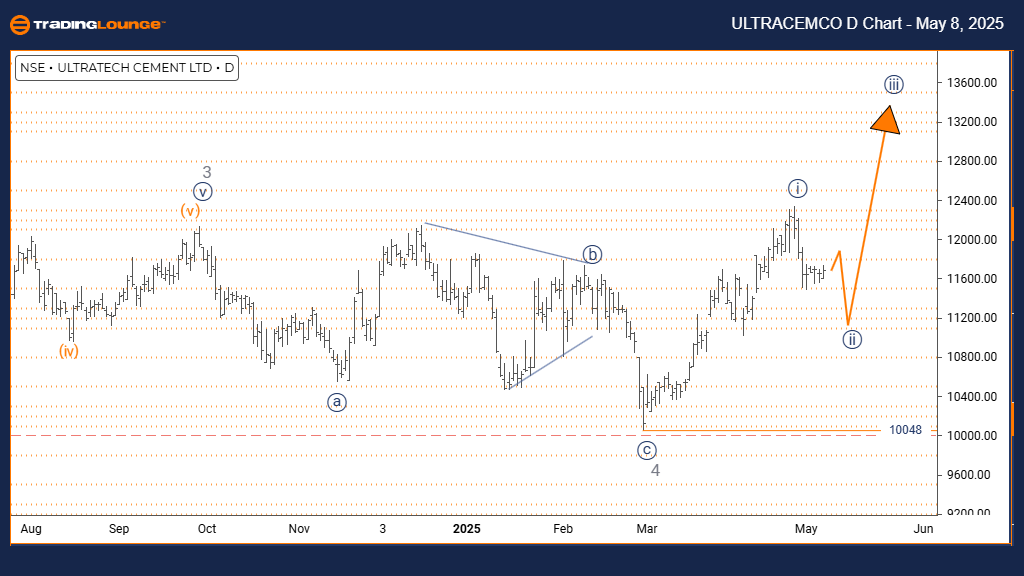
DETAILS: Navy Blue Wave 1 is completed. Navy Blue Wave 2 is currently active. Invalidation level: 10048.
The ULTRATECH CEMENT Elliott Wave Analysis for the daily chart shows a counter-trend movement. The current action is corrective, forming Navy Blue Wave 2 within a broader Gray Wave 5. After completing Navy Blue Wave 1, the stock is now in the process of correcting with Navy Blue Wave 2, preparing for the expected next move into Navy Blue Wave 3.
Analysis indicates that Navy Blue Wave 1 has ended, and Navy Blue Wave 2 is developing. The next higher degree move is likely Navy Blue Wave 3, suggesting a return to bullish momentum. The critical invalidation level remains at 10048. A price move above this level would invalidate the current correction and point to a stronger bullish continuation.
The current corrective function occurs inside a larger bullish setup, meaning the decline is temporary, not a full trend reversal. Being part of Gray Wave 5 supports the view that ULTRATECH CEMENT remains in a long-term bullish phase. This correction phase (Navy Blue Wave 2) could present a strong buying opportunity once confirmed complete.
In summary, ULTRATECH CEMENT is undergoing a corrective pullback (Navy Blue Wave 2) inside a major bullish structure (Gray Wave 5). Traders should prepare for a likely move into Navy Blue Wave 3, restoring upward movement. Monitoring the key invalidation level at 10048 is essential; breaching this level would negate the corrective setup and hint at stronger bullish action. Waiting for confirmation of the correction’s completion is recommended before acting.
Ultratech Cement Elliott Wave Analysis - Trading Lounge Weekly Chart
Ultratech Cement Elliott Wave Technical Analysis
FUNCTION: Bullish Trend
MODE: Impulsive
STRUCTURE: Gray Wave 5
POSITION: Orange Wave 3
DIRECTION NEXT HIGHER DEGREES: Gray Wave 5
DETAILS: Gray Wave 4 has completed. Orange Wave 3 is now progressing. Invalidation level: 10048.
The ULTRATECH CEMENT Elliott Wave Analysis on the weekly chart highlights a bullish trend with impulsive upward movement. The larger wave structure is Gray Wave 5, and the stock is advancing through Orange Wave 3. This confirms that Gray Wave 4 has ended, and bullish momentum is strengthening.
The Elliott Wave setup signals that Gray Wave 5 will continue progressing higher, reinforcing the overall bullish structure. The end of Gray Wave 4 finalized the previous correction, allowing Orange Wave 3 to advance. It is crucial to watch the invalidation level at 10048. A drop below this level would negate the bullish setup and might suggest a deeper correction.
The impulsive nature of the current trend indicates sustained buying pressure. The activity within Orange Wave 3 under Gray Wave 5 suggests strong upward momentum. Traders are advised to confirm bullish continuation signals while keeping an eye on the 10048 invalidation point for risk management.
This weekly analysis underlines ULTRATECH CEMENT’s solid bullish position. Orange Wave 3 is projected to drive prices higher within the broader Gray Wave 5 cycle. The invalidation level provides a clear risk benchmark. Overall, the upside remains strong unless the market decisively falls below 10048. Traders should monitor for signs of strength in the ongoing Orange Wave 3 move.
Technical Analyst: Malik Awais
Source: Visit Tradinglounge.com and learn from the Experts. Join TradingLounge Here
Previous: MAHINDRA & MAHINDRA Elliott Wave Technical Analysis
VALUE Offer - Buy 1 Month & Get 3 Months!Click here
Access 7 Analysts Over 200 Markets Covered. Chat Room With Support
