14Jan

Soybean Elliott Wave Technical Analysis: Price Trends, Technical Chart Insights, Market Forecast, and Long-Term Outlook for Traders

Soybean Elliott Wave Analysis

Soybean prices are in a sideways recovery phase since August 2024. Although they have gained approximately 5%, the long-term trend from June 2022 remains bearish, suggesting a potential price reversal to the downside.

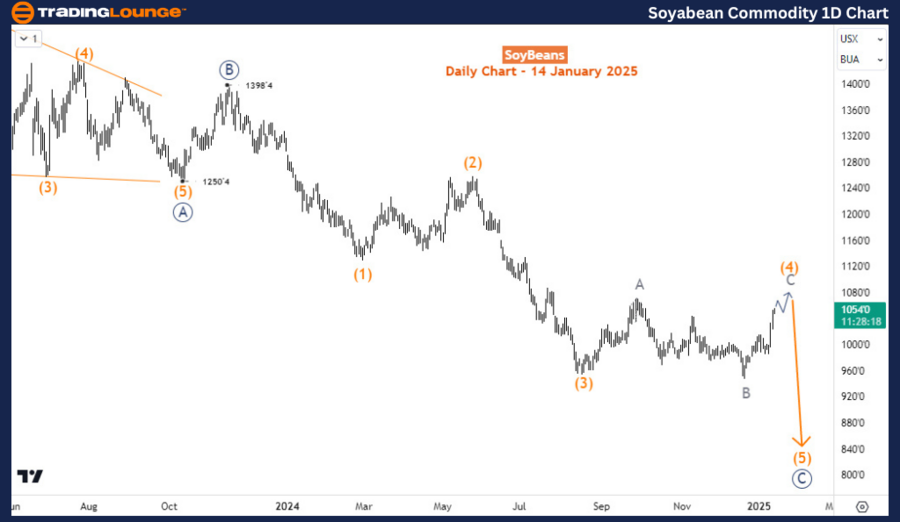
Soybean Daily Chart Analysis

Between May 2019 and June 2022, soybean prices advanced in a 5-wave structure, climbing from $790 to $1787. According to Elliott Wave Theory, this 5-wave trend was followed by a 3-wave corrective pattern. The bearish 3-wave correction, labeled in the primary degree, began in June 2022:

  • Wave ((A)) concluded in October 2024 with a diagonal structure at $1250.
  • Wave ((B)) finished as a zigzag structure at $1398.

Currently, wave ((C)) is unfolding. The bounce from August 2024 represents wave (4) of ((C)). Once wave (4) concludes, wave (5) of ((C)) is expected to push prices lower, completing the correction phase and setting the stage for a potential long-term recovery.

Soybean-Commodity-1d...


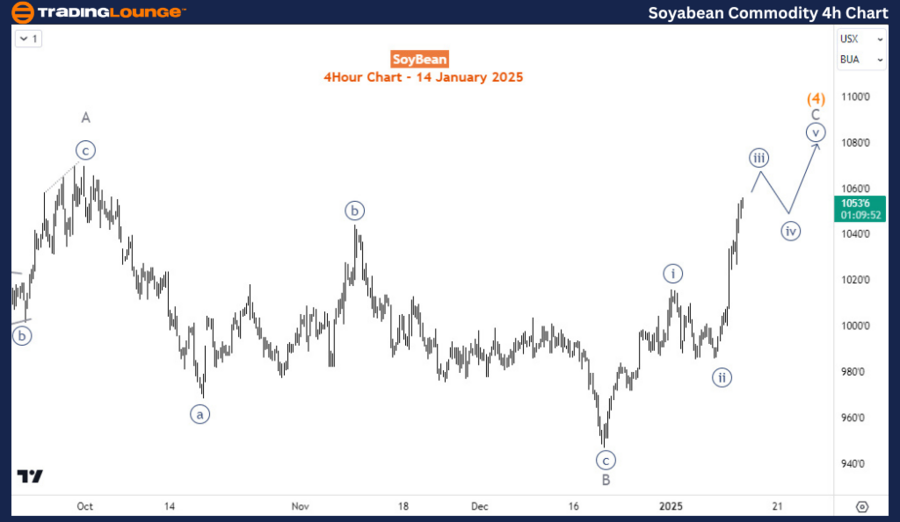
Soybean H4 Chart Analysis

On the 4-hour chart, wave (4) appears to be forming a flat structure, which typically follows a 3-3-5 corrective pattern and has a sideways appearance. Within wave (4), wave C is nearing the completion of a 5-wave structure, likely an impulsive wave. Presently, prices are in wave ((iii)) of wave C of (4), indicating further short-term upside potential.

However, the upward correction may be short-lived, as the long-term bearish trend that started over 2.5 years ago is likely to resume once wave (4) concludes.

Technical Analyst: Sanmi Adeagbo

Source: visit Tradinglounge.com and learn From the Experts Join TradingLounge Here 

See Previous: Silver Elliott Wave Technical Analysis

VALUE Offer - Buy 1 Month & Get 3 Months!Click here

Access 7 Analysts Over 200 Markets Covered. Chat Room With Support

Soybean-Commodity-4h...

Related

CAR Group Limited ASX:CAR Elliott Wave Analysis Signals Bullish Breakout, Wave (5) Targets 41.30, Strong Support at 28.40

CAR Group Limited ASX:CAR Elliott Wave Analysis Signals Bullish Breakout, Wave (5) Targets 41.30, Strong Support at 28.40

ASX: CAR may have completed a corrective wave and is now forming a bullish trend. Wave (5) is unfold...

Read More >
Learn About The REA GROUP LTD – REA Stock Analysis & Elliott Wave Technical Forecast: ASX Trading Success

Learn About The REA GROUP LTD – REA Stock Analysis & Elliott Wave Technical Forecast: ASX Trading Success

Explore our detailed Elliott Wave analysis for REA Group on the Australian Stock Exchange (ASX). Lea...

Read More >
New Zealand Dollar/U.S.Dollar (NZDUSD) Elliott Wave Technical Analysis 7 December 23

New Zealand Dollar/U.S.Dollar (NZDUSD) Elliott Wave Technical Analysis 7 December 23

NZDUSD Elliott Wave Analysis Trading Lounge Day Chart dated 7 December 23, provides a comprehensive ...

Read More >
AAVE/ U.S. dollar(AAVEUSD) Elliott Wave Technical Analysis : Unlocking Profitable AAVE/USD Trading Strategies

AAVE/ U.S. dollar(AAVEUSD) Elliott Wave Technical Analysis : Unlocking Profitable AAVE/USD Trading Strategies

Dive deep into the world of AAVE/USD trading with our expert Elliott Wave Analysis. This guide provi...

Read More >
Forex Analysis of Euro/U.S. Dollar EURUSD Using Elliott Wave Theory Provides Insights into the Current Market Trends

Forex Analysis of Euro/U.S. Dollar EURUSD Using Elliott Wave Theory Provides Insights into the Current Market Trends

This detailed analysis of EURUSD using Elliott Wave Theory provides insights into the current market...

Read More >

Buy 1 Month

Get 3 Months!

Special Offer:

Trade Recommendations

Unleash the power of deversified trading with our comprehensive portfolio, covering:

  • Stock Trades
  • Crypto Trades
  • Forex Trades
  • Commodity Trades
Elliott Wave Analysis

Gain a competive edge with expert insights in to:

  • Global Indices
  • US Stocks & ASX Stocks
  • Forex & Crypto
  • Commodities
Top-Notch Trading Tools

Equip yourself with the tools of success:

  • Social Chat
  • Elliott Wave Algorithm
  • Screener
  • TradingLevels
  • Trading Game
7 Elliott Wave Analysts

Stay ahead of the market with daily charts and insightful videos
-Your secret to strategic trading!

JOIN HERE


Welcome to TradingLounge (ASIC A.R.No. 321187), specialists in trades, trading education and technical analysis, covering stocks, indices, commodities, forex and cryptocurrencies.

When you join TradingLounge you have access to everything we offer, including trade tools, educational content and a social platform to chat with like-minded investors.

Read more

@Copyright 2024 by tradinglounge.com

Contact Us

Australian no: 02 4787 6020

International no: +61 (2) 47876020

Pay with:

Find us on