09Aug

Our Gold XAUUSD Commodity Elliott Wave Technical Analysis and Price Forecast for traders and investors Looking Movement

Gold XAUUSD Commodity Elliott Wave Analysis

Gold Elliott Wave Technical Analysis 

Gold has maintained its upward momentum after breaking out of a two-month consolidation, positioning itself to challenge new all-time highs. The bullish sentiment remains strong across all time frames, presenting traders with opportunities to buy on dips in anticipation of a sustained rally.

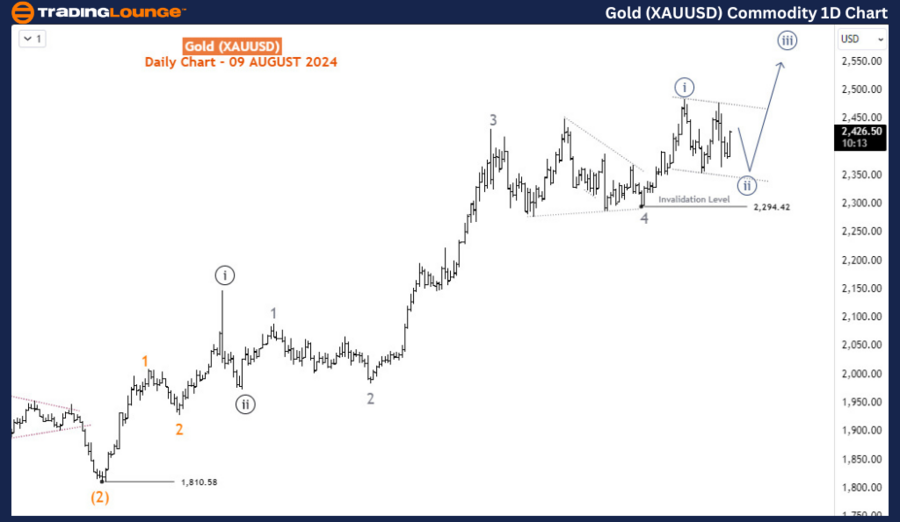
Daily Chart Analysis

On the daily chart, Gold has completed the supercycle wave (IV) within the long-term bullish trend that started in December 2015. This completion has set the stage for a new impulse wave (V). Within wave (V), waves I and II were completed in May and October 2023, respectively. Currently, Gold is advancing in wave (3) of 3 (circled) of III, which has the potential to extend beyond the 2500 level before concluding. The consolidation phase between April 12th and June 26th corresponds to wave 4 of (3). The ongoing upward movement is part of wave 5 of (3), which is expected to surpass previous highs and establish new records. The bullish outlook remains strong, offering traders opportunities to enter positions during pullbacks.
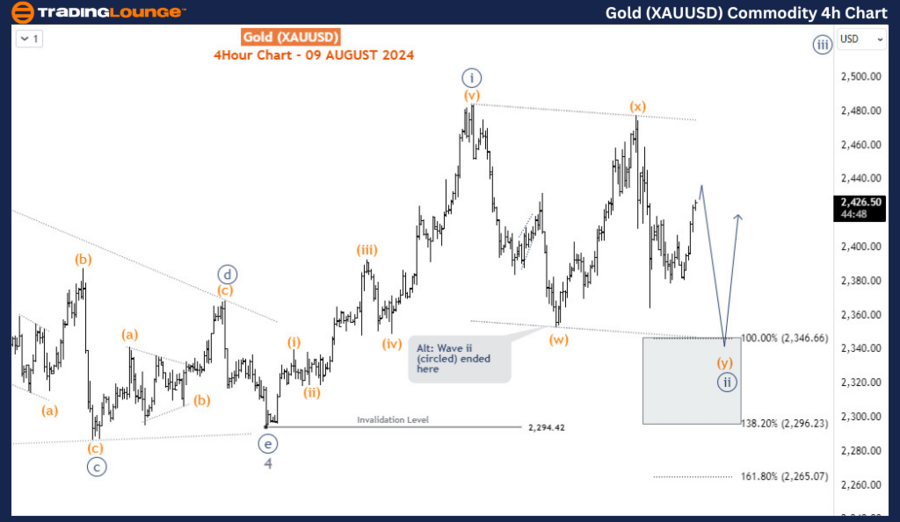
Gold-XAUUSD-Commodit...


H4 Chart Analysis

The H4 chart offers a detailed view of the sub-waves within wave 5 of (3). The price completed wave i (circled) of 5 on July 17th and is currently in a pullback for wave ii (circled) of 5. This pullback could form a double zigzag pattern within the 2346-2296 Fibonacci retracement zone, as long as it stays above the 2294 invalidation level. Alternatively, if wave ii (circled) has already bottomed at the low of July 25th, the current recovery should gain momentum and break through the July 2nd high, continuing the advance into wave iii of 5. In both scenarios, the upside is favored as long as the price remains above 2294.

Conclusion

Gold continues to demonstrate strong bullish momentum, with the potential for further gains and new all-time highs. Traders should monitor for opportunities to enter on pullbacks, particularly around the key support levels within the 2346-2296 zone. The overall outlook remains positive, with the potential for significant upward movement in the coming weeks.

Technical Analyst: Sanmi Adeagbo

Source: visit Tradinglounge.com and learn From the Experts Join TradingLounge Here 

See Previous: Copper Elliott Wave Analysis

Special Trial Offer - 0.76 Cents a Day for 3 Months! Click here

Access 7 Analysts Over 170 Markets Covered. Chat Room With Support

Gold-XAUUSD-Commodit...

Related

NEE Elliott Wave Analysis: Explore NextEra Energy Stock Trends, Flat Structures, and Bullish Reversal Forecasts

NEE Elliott Wave Analysis: Explore NextEra Energy Stock Trends, Flat Structures, and Bullish Reversal Forecasts

Elliott Wave analysis of NextEra Energy (NEE) examines current stock trends, focusing on wave C corr...

Read More >
Elliott Wave Trading Strategies for SP500, NASDAQ, Tech Giants & Bitcoin

Elliott Wave Trading Strategies for SP500, NASDAQ, Tech Giants & Bitcoin

The Expanded Wave IV correction for U.S. indices is nearly complete, with expectations of one more l...

Read More >
NEWMONT CORPORATION - NEM Stock Analysis & Elliott Wave Technical Forecast, Price Targets, & Trading Strategy

NEWMONT CORPORATION - NEM Stock Analysis & Elliott Wave Technical Forecast, Price Targets, & Trading Strategy

Newmont Corporation (ASX:NEM) advances in a strong wave three. Get key Elliott Wave targets, critica...

Read More >
Bitcoin / U.S. dollar(BTCUSD) Elliott Wave Technical Analysis 27 November 23

Bitcoin / U.S. dollar(BTCUSD) Elliott Wave Technical Analysis 27 November 23

Bitcoin/U.S. dollar(BTCUSD) Elliott Wave Technical Analysis on 27 November 23 with BTCUSD Analysis D...

Read More >
Euro/British Pound(EURGBP) 4 Hour Chart Elliott Wave Technical Analysis 15 November 23

Euro/British Pound(EURGBP) 4 Hour Chart Elliott Wave Technical Analysis 15 November 23

Euro/British Pound(EURGBP) 4 Hour Chart Elliott Wave Technical Analysis 15 November 23 offers an in-...

Read More >

$1 for 2 Weeks

then $29 a month!

What a Special Offer!

Trade Recommendations

Unleash the power of deversified trading with our comprehensive portfolio, covering 250+ markets:

  • Stock Trades
  • Crypto Trades
  • Forex Trades
  • Commodity Trades
Elliott Wave Analysis

Gain a competitive edge with expert insights and AI-powered Elliott Wave charting into:

  • Global Indices
  • US Stocks & ASX Stocks
  • Forex & Crypto
  • Commodities
Top-Notch Trading Tools

Equip yourself with the tools of success:

  • Real-time Chat rooms
  • Elliott Wave Algorithm
  • Portfolio tools
  • TradingLevels
  • Screener
  • Trading Game
7 Elliott Wave Analysts

Stay ahead of the market with daily charts and insightful videos
Your secret to strategic trading!

JOIN HERE


Welcome to TradingLounge (ASIC A.R.No. 321187), specialists in trades, trading education and technical analysis, covering stocks, indices, commodities, forex and cryptocurrencies.

When you join TradingLounge you have access to everything we offer, including trade tools, educational content and a social platform to chat with like-minded investors.

Read more

@Copyright 2024 by tradinglounge.com

Contact Us

Australian no: 02 4787 6020

International no: +61 (2) 47876020

Pay with:

Find us on