EURUSD Elliott Wave Analysis – Trading Lounge Day Chart
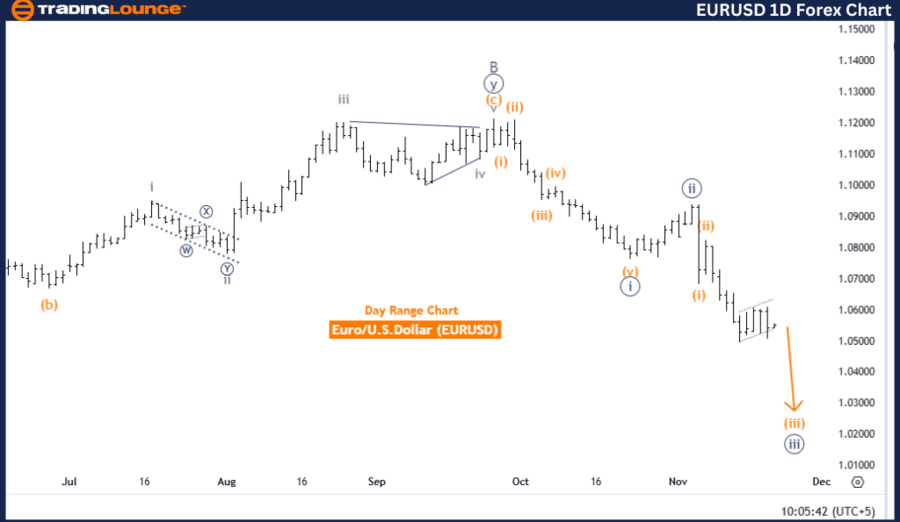
Euro/U.S. Dollar (EURUSD) Day Chart
EURUSD Elliott Wave Technical Analysis
Function: Counter Trend
Mode: Impulsive
Structure: Orange wave 3
Position: Navy blue wave 3
Direction (Next Higher Degrees): Orange wave 4
Details: Orange wave 2 appears completed; orange wave 3 is now unfolding.
Wave Cancel Invalidation Level: 1.08263
The EURUSD daily chart presents a detailed Elliott Wave analysis focused on a counter-trend structure. Currently, the pair is progressing through the impulsive phase, with orange wave 3 actively forming. This phase follows the completion of orange wave 2, indicating further downward movement in the wave sequence.
The present position, navy blue wave 3, is a sub-wave of the larger orange wave 3, underscoring ongoing bearish momentum. This implies the possibility of continued price declines as the impulsive structure evolves. Once orange wave 3 concludes, a higher-degree corrective phase, orange wave 4, is anticipated as the next major development in the Elliott Wave framework.
To maintain this wave count, the invalidation level is set at 1.08263. If the price moves beyond this level, the current wave structure will no longer apply, prompting a reanalysis of market dynamics and future trends.
Key Takeaways:
- The EURUSD daily chart depicts a counter-trend impulsive phase led by orange wave 3.
- Navy blue wave 3 defines the present market position within this structure.
- Invalidation level of 1.08263 is critical for maintaining the accuracy of this analysis.
- Traders should prepare for potential price movements as the counter-trend dynamics evolve.

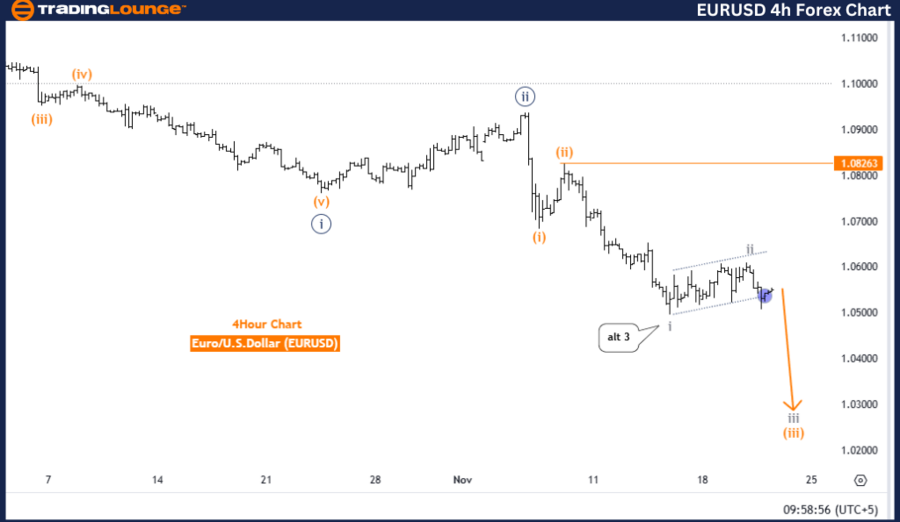
Euro/U.S. Dollar (EURUSD) 4-Hour Chart
EURUSD Elliott Wave Technical Analysis
Function: Bearish Trend
Mode: Impulsive
Structure: Gray wave 3
Position: Orange wave 3
Direction (Next Higher Degrees): Gray wave 4
Details: Gray wave 2 appears completed; gray wave 3 is now in play.
Wave Cancel Invalidation Level: 1.08263
The EURUSD 4-hour chart reveals a bearish Elliott Wave structure, driven by the impulsive phase of gray wave 3. This development comes after the conclusion of gray wave 2, marking sustained downward momentum in the current market cycle.
The ongoing position, orange wave 3, is a sub-wave of gray wave 3, reinforcing the dominant bearish trend. This phase is crucial as it signifies an extension of bearish pressure, potentially driving prices lower. Following the completion of gray wave 3, the Elliott Wave model anticipates the emergence of a corrective phase with gray wave 4.
To validate this analysis, an invalidation level of 1.08263 has been established. A price movement above this threshold would nullify the current wave count, requiring a fresh evaluation of the market's Elliott Wave structure and its implications.
Key Takeaways:
- The EURUSD 4-hour chart emphasizes a bearish trend underpinned by gray wave 3.
- Orange wave 3 represents the current market position, extending the bearish momentum.
- Maintaining the invalidation level of 1.08263 is crucial for this wave analysis.
- Traders should monitor the wave structure for potential bearish extensions or corrective reversals.
Technical Analyst: Malik Awais
Source: visit Tradinglounge.com and learn From the Experts Join TradingLounge Here
Previous: USDJPY Elliott Wave Technical Analysis
VALUE Offer - Buy 1 Month & Get 3 Months!Click here
Access 7 Analysts Over 200 Markets Covered. Chat Room With Support

By focusing on Elliott Wave dynamics, these analyses provide actionable insights for traders navigating the EURUSD counter-trend movements and bearish trends. Monitoring invalidation levels and wave progressions is essential for adapting to potential market shifts.