Wheat Elliott Wave Technical Analysis

Wheat has extended its rally from the July 2024 lows, potentially signaling the start of a more significant bullish correction that could last several weeks. However, until the price breaks out of the current diagonal range and surpasses the May 2024 high, traders should remain cautious of a potential sell-off in the last quarter of 2024.

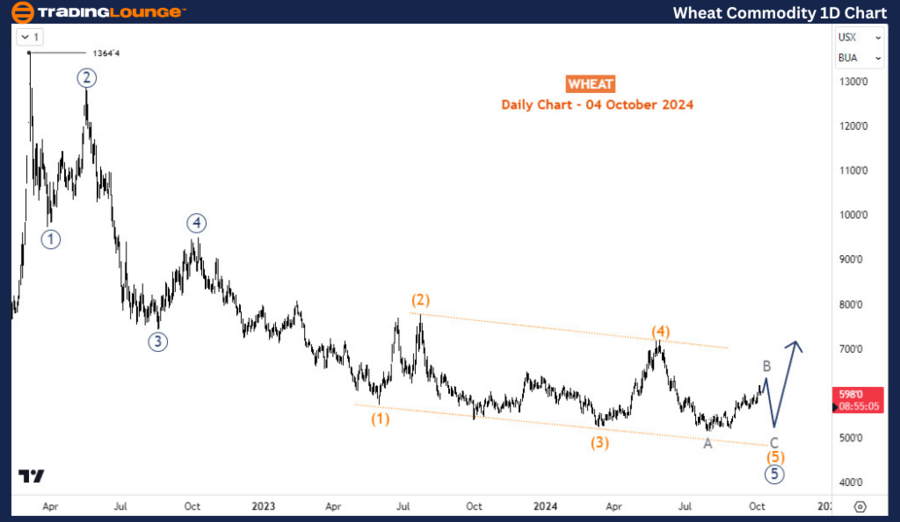
Wheat Commodity Daily Chart Analysis

The fifth wave, labeled as wave 5 (circled) in the primary degree, is currently forming an ending diagonal pattern. This diagonal is part of wave (5), which is expected to unfold in three sub-waves. Currently, wave (5) is in its second phase—wave B—marked by the recent bounce from July's low. Once this structure is complete, a further decline is anticipated, leading to the final leg of the pattern, known as wave C of (5). After wave (5) concludes, a retracement of the entire decline, which started from 1366, could occur over several months.

Alternatively, it’s possible that wave (5) has already completed. If the current recovery continues above wave (4), which corresponds to the May 2024 high, it will confirm that wave (5) of 5 (circled) ended at the July 2024 low. In this scenario, a stronger recovery correcting the entire bearish impulse from March 2022 is likely. However, until this occurs, one more leg lower for wave C of (5) should be considered after the current wave B bounce completes.

Wheat-Commodity-1D-C...


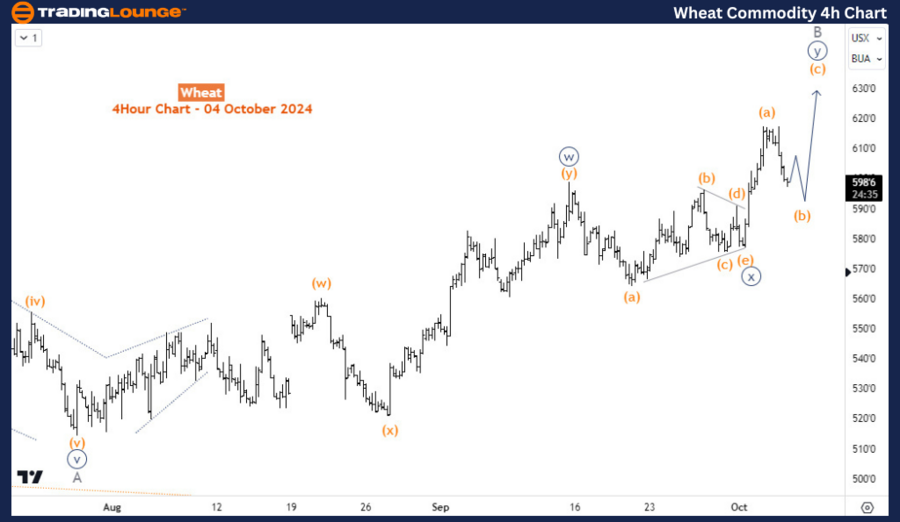
Wheat Commodity H4 Chart Analysis

Wave B of (5) is extending higher within a double zigzag structure. Waves ((w)) and ((y)) of B are complete. Currently, the price is in wave (b) of ((y)) of B. At least one more upward leg, wave (c) of ((y)) of B, is expected in the short term.

Technical Analyst: Sanmi Adeagbo

Source: visit Tradinglounge.com and learn From the Experts Join TradingLounge Here 

See Previous: GX Uranium ETF Elliott Wave Technical Analysis

VALUE Offer - Buy 1 Month & Get 3 Months!Click here

Access 7 Analysts Over 200 Markets Covered. Chat Room With Support

Wheat-Commodity-4h-C...


Related

AAPL Elliott Wave Analysis: Exploring Market Corrections and Potential Trends - Trading Lounge Insights

AAPL Elliott Wave Analysis: Exploring Market Corrections and Potential Trends - Trading Lounge Insights

Delve into the Elliott Wave Analysis of Apple Inc. (AAPL) with our in-depth technical analysis, exam...

Read More >
Unveiling Costco Wholesale Corp.,(COST) Elliott Wave Analysis for Potential Trading Opportunities

Unveiling Costco Wholesale Corp.,(COST) Elliott Wave Analysis for Potential Trading Opportunities

Join us at the COST Elliott Wave Trading Lounge for our in-depth analysis of Costco Wholesale Corp. ...

Read More >
NVIDIA Corp. (NVDA) Elliott Wave Analysis: Bullish Trend Outlook, Price Prediction, Technical Analysis, and Wave 3 Projection

NVIDIA Corp. (NVDA) Elliott Wave Analysis: Bullish Trend Outlook, Price Prediction, Technical Analysis, and Wave 3 Projection

This NVIDIA Elliott Wave Analysis provides an in-depth look at NVDA's stock trend, identifying k...

Read More >
DAX 40 Elliott Wave Analysis Reveals Bullish Forecasts, Trading Strategies, Wave Counts, and Germany Market Trends

DAX 40 Elliott Wave Analysis Reveals Bullish Forecasts, Trading Strategies, Wave Counts, and Germany Market Trends

Analyse DAX 40’s bullish Elliott Wave structure on daily and weekly charts. Discover trading strate...

Read More >
Polkadot Elliott Wave Technical Forecast: DOT Crypto Price Set for Reversal as Wave 2 Nears Completion with Strong Wave 3 Ahead

Polkadot Elliott Wave Technical Forecast: DOT Crypto Price Set for Reversal as Wave 2 Nears Completion with Strong Wave 3 Ahead

Polkadot (DOT) is in a wave 2 correction phase, with potential bullish reversal near $3.62–$3.94. E...

Read More >
An in-depth look at The TJX Companies Inc.(TJX) Stocks Technical Analysis through the lens of Elliott Wave theory

An in-depth look at The TJX Companies Inc.(TJX) Stocks Technical Analysis through the lens of Elliott Wave theory

This analysis provides an in-depth look at TJX Companies Inc. through the lens of Elliott Wave theor...

Read More >

$1 for 2 Weeks

then $29 a month!

What a Special Offer!

Trade Recommendations

Unleash the power of deversified trading with our comprehensive portfolio, covering 250+ markets:

  • Stock Trades
  • Crypto Trades
  • Forex Trades
  • Commodity Trades
Elliott Wave Analysis

Gain a competitive edge with expert insights and AI-powered Elliott Wave charting into:

  • Global Indices
  • US Stocks & ASX Stocks
  • Forex & Crypto
  • Commodities
Top-Notch Trading Tools

Equip yourself with the tools of success:

  • Real-time Chat rooms
  • Elliott Wave Algorithm
  • Portfolio tools
  • TradingLevels
  • Screener
  • Trading Game
7 Elliott Wave Analysts

Stay ahead of the market with daily charts and insightful videos
Your secret to strategic trading!

JOIN HERE


Welcome to TradingLounge (ASIC A.R.No. 321187), specialists in trades, trading education and technical analysis, covering stocks, indices, commodities, forex and cryptocurrencies.

When you join TradingLounge you have access to everything we offer, including trade tools, educational content and a social platform to chat with like-minded investors.

Read more

@Copyright 2024 by tradinglounge.com

Contact Us

Australian no: 02 4787 6020

International no: +61 (2) 47876020

Pay with:

Find us on