11Mar

AAPL Elliott Wave Analysis: Exploring Market Corrections and Potential Trends - Trading Lounge Insights

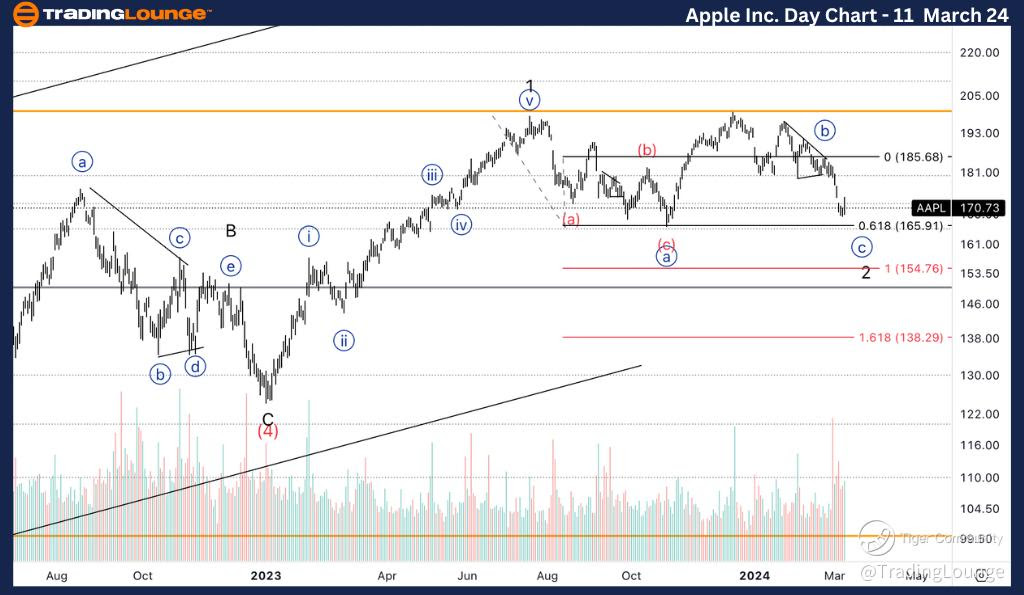
AAPL Elliott Wave Analysis Trading Lounge Daily Chart, 11 March 24

In the dynamic landscape of financial markets, understanding Elliott Wave Analysis can provide valuable insights into market trends and potential price movements. Let's explore the recent Elliott Wave Analysis of Apple Inc. (AAPL) to decipher corrective patterns and anticipate market directions for strategic trading decisions.

AAPL Stock Daily Chart Analysis

AAPL Elliott Wave Technical Analysis

Function: Counter Trend

Mode: Corrective

Structure: Flat

Position: Minor wave 2

Direction: Completion of wave {c} of 2

On the daily chart, AAPL exhibits a counter-trend movement, indicating corrective patterns within a flat structure. Currently positioned within minor wave 2, the completion of wave {c} of 2 suggests a potential downside. While further downside is anticipated, there's a possibility of a larger degree correction, potentially reaching a top at $200.

Apple-Inc-Day-stock-...


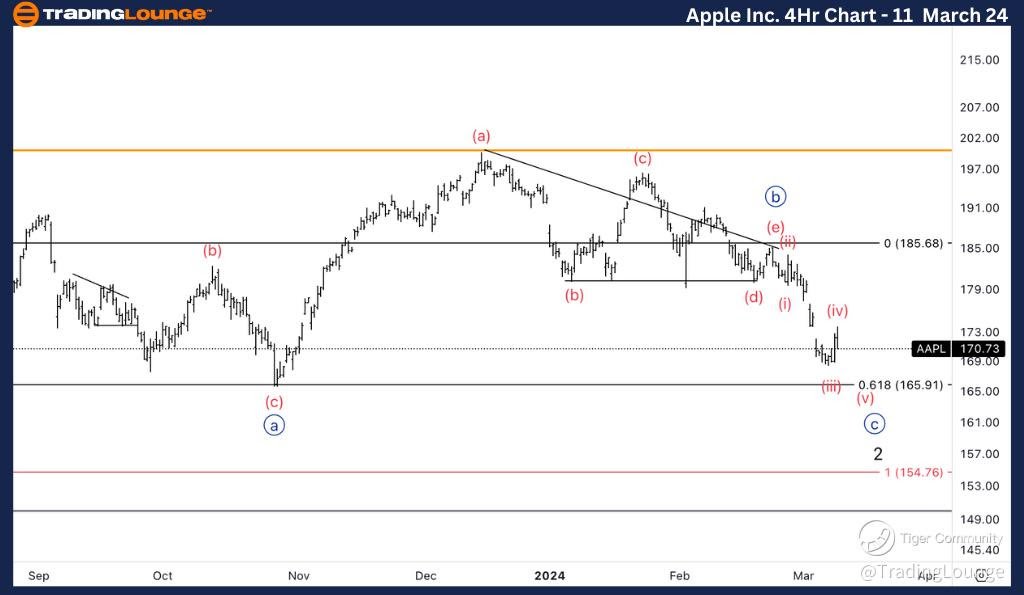
AAPL Elliott Wave Analysis Trading Lounge 4Hr Chart, 11 March 24

Apple Inc., (AAPL) 4Hr Chart Analysis

AAPL Elliott Wave Technical Analysis

Function: Counter Trend

Mode: Corrective

Structure: Flat

Position: Wave (iv) of {c}

Direction: Completion of wave {c} of 2

Analyzing the 4-hour chart, AAPL continues to display counter-trend movements within a corrective mode. The structure appears flat, with the current position in wave (iv) of {c}. Observing Friday's close, increased selling pressure emerged after encountering resistance around the 173s level. The market is expected to move lower towards the bottom of MG2, potentially reaching $165.

Stay informed with our comprehensive Elliott Wave Analysis to navigate market fluctuations and make informed trading decisions. By understanding corrective patterns and potential market directions, traders can position themselves strategically to capitalize on emerging opportunities.

In conclusion, AAPL's Elliott Wave Analysis indicates ongoing corrections within a counter-trend framework. While minor wave 2 and wave (iv) of {c} are currently in focus, traders should remain vigilant for potential shifts in market dynamics. Utilize our insights to stay ahead of market movements and optimize your trading strategies effectively.

Technical Analyst: Alessio Barretta

Source: visit Tradinglounge.com and learn From the Experts Join TradingLounge Here 

See Previous: Costco Wholesale Corp., (COST) 

TradingLounge Once Off SPECIAL DEAL: Here > 1 month Get 3 months.

Apple-Inc-4Hr-stock-...

Related

BTCUSD Elliott Wave Analysis: Corrective Zigzag Pattern Unfolds - TradingLounge Insights 7 February 24

BTCUSD Elliott Wave Analysis: Corrective Zigzag Pattern Unfolds - TradingLounge Insights 7 February 24

Discover insights into BTCUSD Elliott Wave Analysis dated 7 February 24 by TradingLounge, delving in...

Read More >
Netflix Inc. (NFLX) Stock Forecast: Elliott Wave Analysis Reveals NFLX Price Prediction, Technical Trends, and Key Trading Levels

Netflix Inc. (NFLX) Stock Forecast: Elliott Wave Analysis Reveals NFLX Price Prediction, Technical Trends, and Key Trading Levels

Netflix (NFLX) stock analysis using Elliott Wave principles. Understand current wave positions, pric...

Read More >
BNBUSD Elliott Wave Analysis Reveals Triangle Pattern, Fibonacci Support, and Bullish Breakout Strategy for Binance Coin Traders

BNBUSD Elliott Wave Analysis Reveals Triangle Pattern, Fibonacci Support, and Bullish Breakout Strategy for Binance Coin Traders

BNBUSD’s current Elliott Wave pattern, focusing on Wave IV's corrective triangle and the potent...

Read More >
Shanghai Composite Index Elliott Wave Technical Analysis with SSE Price Predictions, Market Trends, and Financial Insights

Shanghai Composite Index Elliott Wave Technical Analysis with SSE Price Predictions, Market Trends, and Financial Insights

This analysis provides a detailed Elliott Wave breakdown of the Shanghai Composite Index (SSE), high...

Read More >
KOSPI Composite Elliott Wave Analysis: Market Forecast, Key Support at 2,438.17, Trading Strategy & Price Prediction

KOSPI Composite Elliott Wave Analysis: Market Forecast, Key Support at 2,438.17, Trading Strategy & Price Prediction

The KOSPI Composite Elliott Wave Analysis indicates a bullish trend, with the market currently in Or...

Read More >
Provides a Diversified Portfolio in the Uranium industry With GX URA ETF Commodity Elliott Wave Technical Analysis

Provides a Diversified Portfolio in the Uranium industry With GX URA ETF Commodity Elliott Wave Technical Analysis

The GX URA ETF, or Global X Uranium ETF, provides a diversified portfolio in the uranium industry. T...

Read More >

$1 for 2 Weeks

then $29 a month!

What a Special Offer!

Trade Recommendations

Unleash the power of deversified trading with our comprehensive portfolio, covering 250+ markets:

  • Stock Trades
  • Crypto Trades
  • Forex Trades
  • Commodity Trades
Elliott Wave Analysis

Gain a competitive edge with expert insights and AI-powered Elliott Wave charting into:

  • Global Indices
  • US Stocks & ASX Stocks
  • Forex & Crypto
  • Commodities
Top-Notch Trading Tools

Equip yourself with the tools of success:

  • Real-time Chat rooms
  • Elliott Wave Algorithm
  • Portfolio tools
  • TradingLevels
  • Screener
  • Trading Game
7 Elliott Wave Analysts

Stay ahead of the market with daily charts and insightful videos
Your secret to strategic trading!

JOIN HERE


Welcome to TradingLounge (ASIC A.R.No. 321187), specialists in trades, trading education and technical analysis, covering stocks, indices, commodities, forex and cryptocurrencies.

When you join TradingLounge you have access to everything we offer, including trade tools, educational content and a social platform to chat with like-minded investors.

Read more

@Copyright 2024 by tradinglounge.com

Contact Us

Australian no: 02 4787 6020

International no: +61 (2) 47876020

Pay with:

Find us on