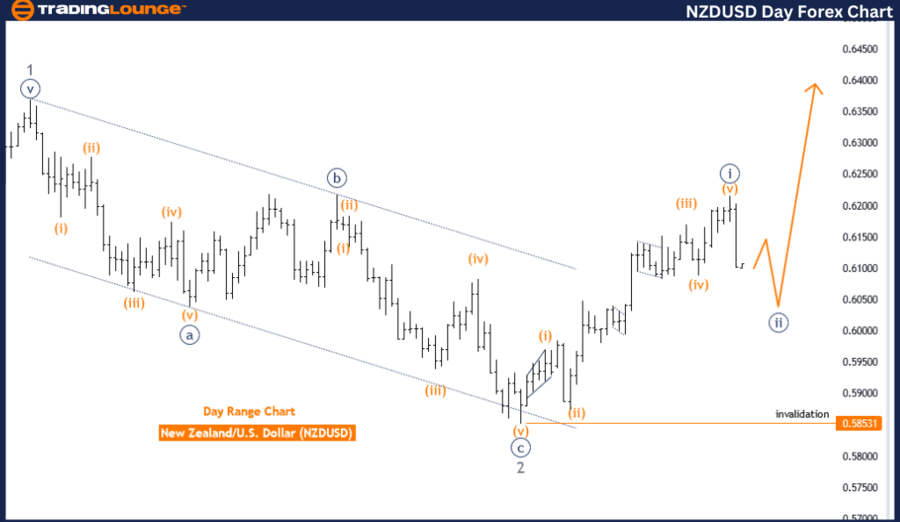
NZDUSD Elliott Wave Analysis Trading Lounge Day Chart
New Zealand Dollar/U.S. Dollar (NZDUSD) Day Chart Analysis
NZDUSD Elliott Wave Technical Analysis
FUNCTION: Trend
MODE: Corrective
STRUCTURE: Navy Blue Wave 2
POSITION: Gray wave 3
DIRECTION NEXT HIGHER DEGREES: Navy blue wave 3
DETAILS: Navy Blue Wave 1 looking completed at 0.62159, now Navy Blue Wave 2 is in play.
Wave Cancel Invalid Level: 0.58531
The NZDUSD Elliott Wave analysis on the daily chart shows a trending market in a corrective mode. This means the overall trend is continuing, but the market is currently experiencing a corrective phase. The structure of this correction is navy blue wave 2 within gray wave 3, indicating an intermediate corrective phase in a larger trend.
Navy Blue Wave 1 likely completed at 0.62159. This marks the end of the initial impulsive wave in the broader trend, leading to the current corrective phase, Navy Blue Wave 2. This phase indicates a pullback or retracement after the completion of Navy Blue Wave 1.
The next higher degrees suggest the continuation of Navy Blue Wave 3 after the current corrective phase ends. This implies that once Navy Blue Wave 2 concludes, the market is expected to resume its trend direction with Navy Blue Wave 3, typically a strong impulsive move in the primary trend direction.
A key aspect of this analysis is the wave cancel invalid level at 0.58531. If the market price falls below this level, it would invalidate the current wave structure, requiring a reevaluation of the wave analysis and possibly changing the expected market direction.
In summary, the NZDUSD daily chart analysis highlights a trending market in a corrective phase, identified as navy blue wave 2 within gray wave 3. The completion of Navy Blue Wave 1 at 0.62159 has led to the current corrective phase of Navy Blue Wave 2. The wave cancel invalid level at 0.58531 is crucial for maintaining the accuracy of the current wave count. This analysis provides a comprehensive understanding of the current corrective phase, helping traders anticipate potential market moves and make informed trading decisions based on the expected trend continuation.
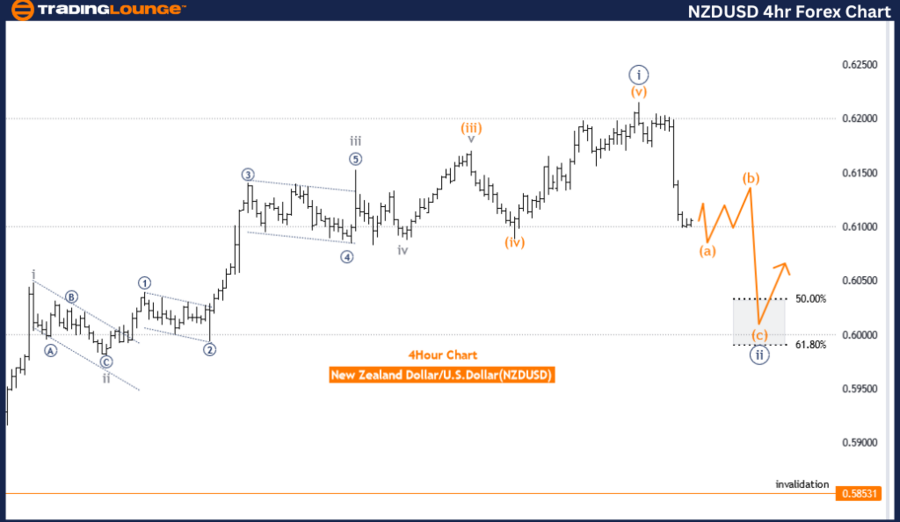
NZDUSD Elliott Wave Analysis Trading Lounge 4-Hour Chart
New Zealand Dollar/U.S. Dollar (NZDUSD) 4-Hour Chart Analysis
NZDUSD Elliott Wave Technical Analysis
FUNCTION: Counter Trend
MODE: Corrective
STRUCTURE: Orange wave A
POSITION: Navy Blue Wave 2
DIRECTION NEXT HIGHER DEGREES: Orange wave B
DETAILS: Orange wave A of 2 still is in play and looking near the end.
Wave Cancel Invalid Level: 0.58531
The NZDUSD Elliott Wave analysis on the 4-hour chart indicates a counter-trend movement, showing a temporary deviation from the main trend. This movement is corrective, suggesting the current price action is adjusting before potentially resuming the primary trend. The structure is orange wave A within navy blue wave 2, highlighting a corrective phase in the broader wave cycle.
Orange wave A of 2 is still in play and appears to be nearing its completion. This phase typically represents the initial leg of a corrective wave, where the market undergoes a retracement or pullback. The completion of orange wave A will likely lead to the start of orange wave B, generally a move opposite to wave A as part of the corrective pattern.
The next higher degrees indicate that orange wave B is expected to follow. This suggests that after orange wave A ends, the market might experience a rebound or counter move as orange wave B, contributing to the overall corrective structure.
A key aspect of this analysis is the wave cancel invalid level at 0.58531. If the market price drops below this level, it would invalidate the current wave structure, requiring a reevaluation of the wave analysis and possibly changing the expected market direction.
In summary, the NZDUSD 4-hour chart analysis reveals a counter-trend movement in a corrective mode, with the current structure as orange wave A within navy blue wave 2. Orange wave A appears to be nearing its end, setting the stage for orange wave B. The wave cancel invalid level at 0.58531 is crucial for maintaining the accuracy of the current wave count. This analysis provides a detailed understanding of the corrective phase, helping traders anticipate potential market reversals and make informed trading decisions based on the expected wave pattern continuation.
Technical Analyst: Malik Awais
Source: visit Tradinglounge.com and learn From the Experts Join TradingLounge Here
Previous: GBPAUD Elliott Wave Technical Analysis
Special Trial Offer - 0.76 Cents a Day for 3 Months! Click here
Access 7 Analysts Over 170 Markets Covered. Chat Room With Support