Natural Gas Elliott Wave Technical Analysis
Natural Gas is currently in a recovery phase from its August 2024 low. However, technical indicators point toward potential resistance ahead, which may continue the bearish trend that began from its June 2024 high. This Elliott Wave analysis provides key insights into the potential for further downside and the critical levels to monitor in the upcoming weeks.
Natural Gas Long-Term Chart Analysis
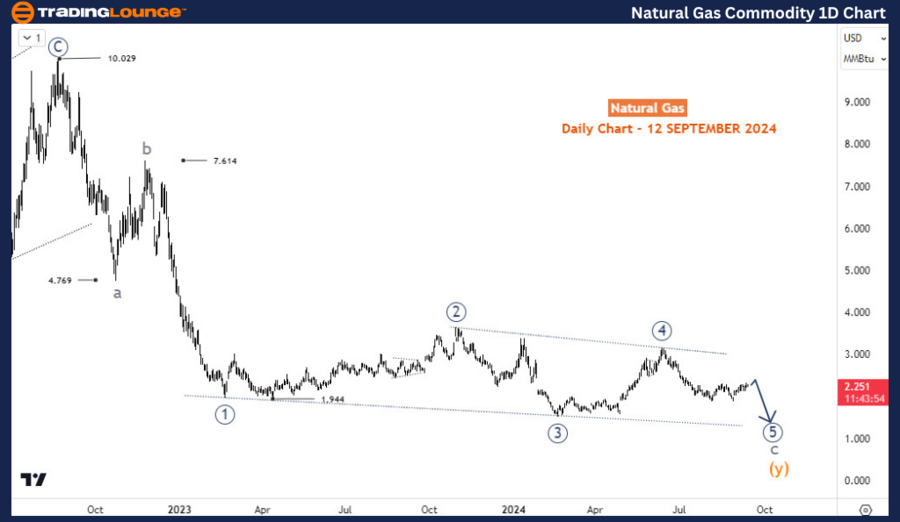
On the daily chart, Natural Gas has been in a prolonged downtrend since reaching its peak of nearly $10 in August 2022. This decline follows an a-b-c corrective pattern of the cycle degree. The first leg of this correction, wave a, concluded around the $4.77 mark. Subsequently, the market rallied in wave b, peaking near $7.61.
Since November 2022, Natural Gas has been progressing through the final leg of this corrective structure, moving within an ending diagonal in wave c. Ending diagonals typically indicate the conclusion of larger corrective patterns, suggesting the current bearish trend may soon end. Despite this, further downside is expected before a significant bottom is in place.
The ongoing phase represents the fifth and final leg of the ending diagonal, marked as wave 5 (circled). This leg is unfolding as a three-wave structure and is expected to break below the previous low of wave 3 (circled), which hit 1.524. Upon completing wave 5 (circled), the entire a-b-c correction will likely end, potentially signaling the conclusion of the long-term downtrend. This could set the stage for a longer-term bullish phase.
TradingLounge Natural Gas Commodity Daily Chart Analysis
The daily chart confirms that Natural Gas is currently in the fifth wave of the diagonal pattern. This wave is developing as a three-wave structure, and the market may face additional downward pressure, especially as it approaches and potentially breaks below the 1.524 low from wave 3 (circled). The continuation of this bearish momentum could mark the final leg of wave 5 (circled), completing the larger corrective cycle.
TradingLounge Natural Gas Commodity H4 Chart Analysis
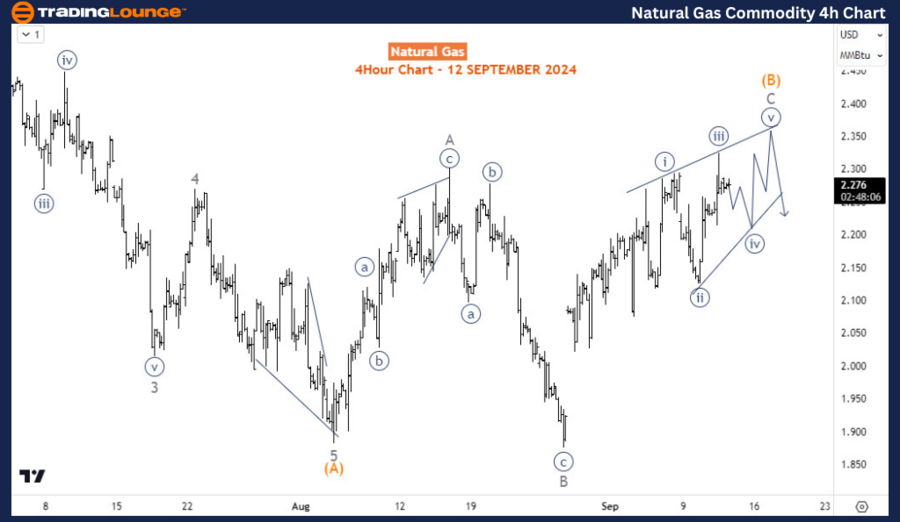
Focusing on the H4 chart, we gain a clearer view of the recent price movements. The first leg of the current decline, wave (A), concluded as an impulse sequence at 1.88 in early August 2024. Following this, a corrective bounce occurred in wave (B), which appears to have formed an irregular flat pattern. Wave A of this flat correction completed on August 15, 2024, followed by wave B, which briefly dipped below the starting price of wave A before bottoming at the August 2024 low.
Wave C of (B) is currently developing, but the price action remains choppy, particularly near its upper range. The most probable outcome suggests that an ending diagonal pattern may form in wave C, though the structure is not yet fully clear. It would be prudent to wait for a break below wave B's low to confirm the resumption of the bearish trend.
Once wave C of (B) concludes, the market is expected to continue its downward trajectory, maintaining the larger bearish sequence that started in June 2024. A break below wave B's low will be a crucial signal, indicating the return of bearish dominance and confirming that the final leg of wave 5 (circled) is underway.
Technical Analyst: Sanmi Adeagbo
Source: visit Tradinglounge.com and learn From the Experts Join TradingLounge Here
See Previous: Coffee Elliott Wave Technical Analysis
Special Trial Offer - 0.76 Cents a Day for 3 Months! Click here
Access 7 Analysts Over 200 Markets Covered. Chat Room With Support
Conclusion
Natural Gas remains in the final stages of a long-term corrective pattern, with further downside anticipated before a trend reversal occurs. The Elliott Wave structure suggests that wave 5 (circled) of the ongoing diagonal pattern is still unfolding, and a break below 1.524 is expected in the near future. On the H4 chart, while the structure remains challenging, a breach of wave B's low would likely confirm the resumption of the bearish trend. Traders should remain cautious but also prepare for a potential buying opportunity once the final leg of this correction concludes.