Johnson & Johnson (JNJ) Daily Chart: Unraveling the Elliott Wave Perspective

The Elliott Wave Principle, a form of technical analysis that traders use to analyze financial market cycles and forecast market trends by identifying extremes in investor psychology, highs, and lows in prices, offers a compelling view of Johnson & Johnson's (JNJ) stock performance. This analysis aims to provide insights into JNJ's current market positioning and potential future movements through the lens of the Elliott Wave Theory.

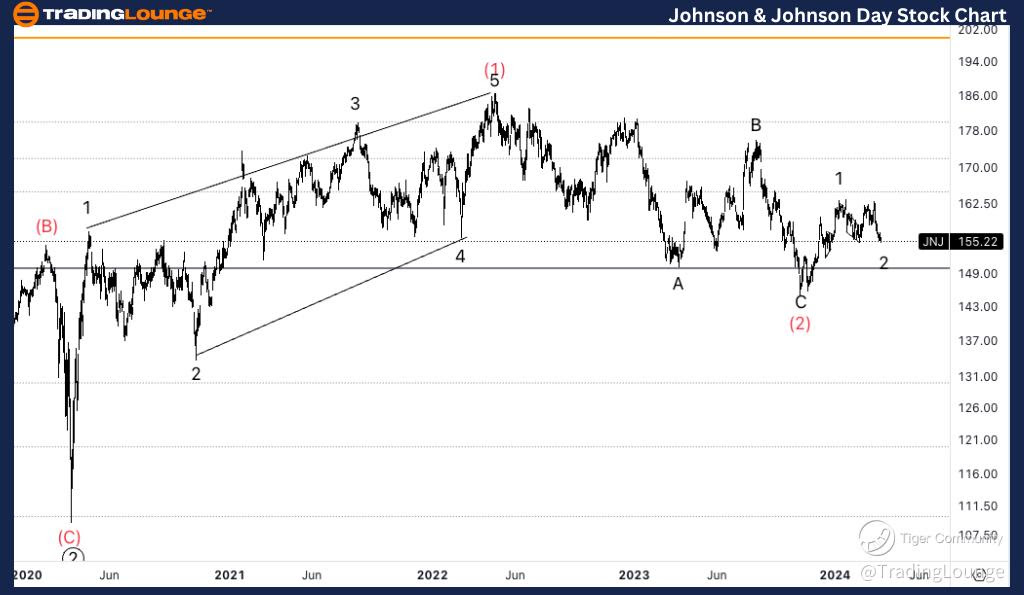
JNJ Elliott Wave Technical Analysis

Elliott Wave Technical Breakdown for JNJ: Daily Chart Examination

  • Function: Trend Analysis
  • Mode: Impulsive Moves
  • Structure: Motive Phase
  • Current Position: Wave (3)
  • Expected Direction: The anticipation of an upward trajectory in wave 3 of (3).

Detailed Insight: The analysis points towards an expected three-wave move culminating in wave (2), following which a significant support level was identified at $150. This support marks a crucial juncture, hinting at the necessity of further upside movement to confirm the commencement of wave (3). Traders and investors are keenly observing these patterns, understanding that the confirmation of wave (3) would signify a strong bullish trend.

JNJ-Day-Stock-chart-...


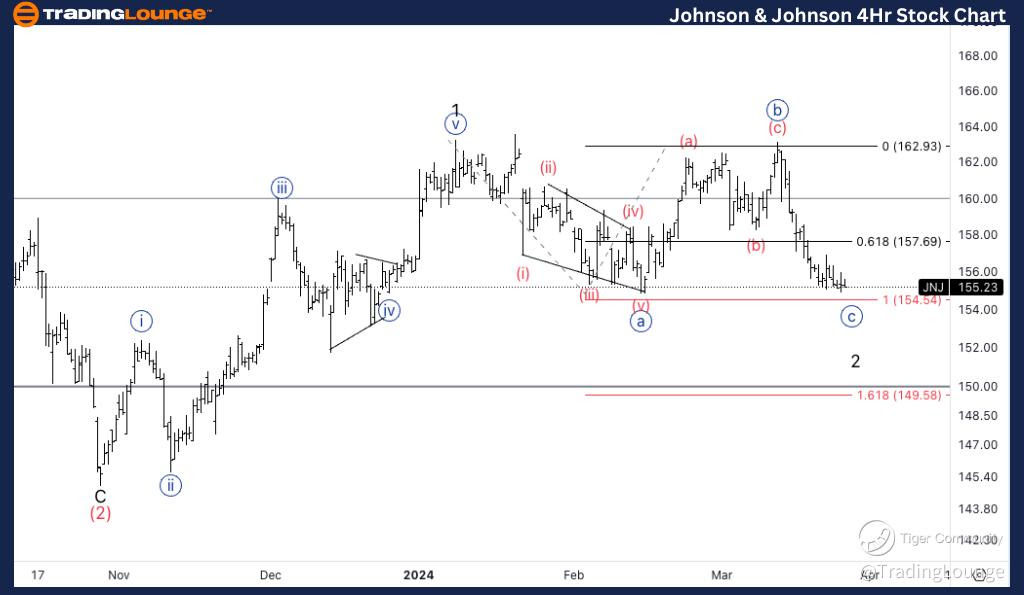
Johnson & Johnson (JNJ) 4-Hour Chart: A Closer Look with Elliott Wave

The shorter-term, 4-hour chart analysis of JNJ offers a more granular view of the stock's movement, aligning with the broader trends observed on the daily chart.

Elliott Wave Technical Analysis: 4-Hour Chart Deep Dive

  • Function: Trend Analysis
  • Mode: Impulsive Movements
  • Structure: Motive Sequence
  • Current Position: Wave {c} of 2
  • Projected Direction: Transition into wave 3

Analytical Overview: This segment of the analysis focuses on the imminent move into wave {c}, aiming for parity between waves {c} and {a}. The critical observation here is the stock's trajectory towards a support range between $155 and $150. This anticipated support zone is pivotal, as finding solid ground within this range could catalyze the stock's turnaround into wave 3, marking a significant bullish indicator.

Conclusion: Navigating Johnson & Johnson's Market Dynamics with Elliott Wave Analysis

The Elliott Wave Analysis offers a structured and nuanced approach to understanding Johnson & Johnson's stock movements. By dissecting the wave patterns and their implications on the daily and 4-hour charts, traders and investors can gain deeper insights into the potential future directions of JNJ's stock. The identification of critical support levels and the anticipation of impulsive waves underscore the dynamic nature of the financial markets and the value of Elliott Wave Analysis as a tool for navigating them. As JNJ approaches these crucial junctures, market participants will be watching closely, ready to align their strategies with the unfolding wave patterns.

Technical Analyst: Alessio Barretta

Source: visit Tradinglounge.com and learn From the Experts Join TradingLounge Here 

See Previous: Netflix Inc., (NFLX)

TradingLounge Once Off SPECIAL DEAL: Here > 1 month Get 3 months.

JNJ-4Hr-Stock-chart-...

Related

Navigating the Waves: Dogecoin Crypto Price News Today and DOGEUSD Elliott Wave Technical Analysis

Navigating the Waves: Dogecoin Crypto Price News Today and DOGEUSD Elliott Wave Technical Analysis

This article provides a detailed Elliott Wave analysis of the Dogecoin/U.S. dollar (DOGEUSD) pair, o...

Read More >
Tech Mahindra Stocks Elliott Wave Technical Analysis: Insights into Potential Stock Movements and Price Predictions

Tech Mahindra Stocks Elliott Wave Technical Analysis: Insights into Potential Stock Movements and Price Predictions

This article provides a comprehensive Elliott Wave analysis of Tech Mahindra, offering insights into...

Read More >
Elliott Wave Analysis: Bearish and Bullish Scenarios for SP 500 and Nasdaq 100

Elliott Wave Analysis: Bearish and Bullish Scenarios for SP 500 and Nasdaq 100

The Elliott Wave analysis of the SP 500 and Nasdaq 100 indices suggests a predominant bearish trend ...

Read More >
MARA Holdings Inc. (MARA) U.S. Stocks Elliott Wave Technical Analysis: Shows Bullish Price Move and Weekly Resistance Nearing

MARA Holdings Inc. (MARA) U.S. Stocks Elliott Wave Technical Analysis: Shows Bullish Price Move and Weekly Resistance Nearing

This analysis of MARA Holdings uses Elliott Wave theory to project price moves on daily and weekly c...

Read More >
CSX Corp. (CSX) U.S. Stocks Elliott Wave Technical Daily & 1‑Hour Analysis: Wave 3 Bullish, $33 Top, $30 Retracement Setup

CSX Corp. (CSX) U.S. Stocks Elliott Wave Technical Daily & 1‑Hour Analysis: Wave 3 Bullish, $33 Top, $30 Retracement Setup

This CSX Elliott Wave analysis covers both daily and 1‑hour charts. On the daily timeframe, CSX is ...

Read More >
Bitcoin (BTCUSD) Elliott Wave Analysis: Trading Strategy, Key Support & Resistance Levels, and Short-Term Crypto Market Trends

Bitcoin (BTCUSD) Elliott Wave Analysis: Trading Strategy, Key Support & Resistance Levels, and Short-Term Crypto Market Trends

Bitcoin Elliott Wave analysis provides an in-depth look at BTCUSD's current corrective phase, de...

Read More >

$1 for 2 Weeks

then $29 a month!

What a Special Offer!

Trade Recommendations

Unleash the power of deversified trading with our comprehensive portfolio, covering 250+ markets:

  • Stock Trades
  • Crypto Trades
  • Forex Trades
  • Commodity Trades
Elliott Wave Analysis

Gain a competitive edge with expert insights and AI-powered Elliott Wave charting into:

  • Global Indices
  • US Stocks & ASX Stocks
  • Forex & Crypto
  • Commodities
Top-Notch Trading Tools

Equip yourself with the tools of success:

  • Real-time Chat rooms
  • Elliott Wave Algorithm
  • Portfolio tools
  • TradingLevels
  • Screener
  • Trading Game
7 Elliott Wave Analysts

Stay ahead of the market with daily charts and insightful videos
Your secret to strategic trading!

JOIN HERE


Welcome to TradingLounge (ASIC A.R.No. 321187), specialists in trades, trading education and technical analysis, covering stocks, indices, commodities, forex and cryptocurrencies.

When you join TradingLounge you have access to everything we offer, including trade tools, educational content and a social platform to chat with like-minded investors.

Read more

@Copyright 2024 by tradinglounge.com

Contact Us

Australian no: 02 4787 6020

International no: +61 (2) 47876020

Pay with:

Find us on