TradingLounge Australian Dollar / Japanese Yen Elliott Wave Analysis Day Chart
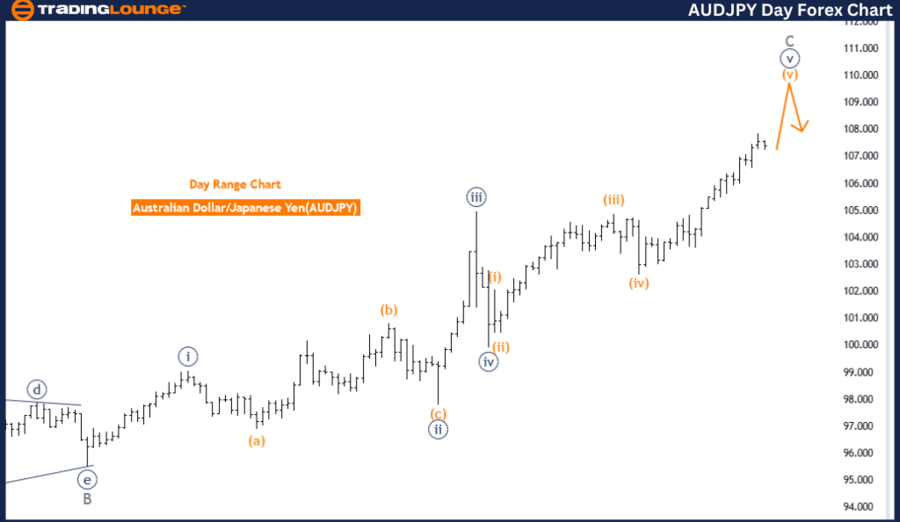
Australian Dollar / Japanese Yen (AUDJPY) Day Chart Analysis
AUDJPY Elliott Wave Technical Analysis
Function: Counter Trend
Mode: Impulsive
Structure: Orange Wave 5
Position: Navy Blue Wave 5 of C
Direction Next Lower Degrees: Orange Wave 1 of New Bearish Trend
Details:
The analysis indicates that orange wave 4 of 5 is complete, and orange wave 5 of 5 is currently nearing its end.
The Elliott Wave analysis for the Australian Dollar / Japanese Yen (AUDJPY) daily chart suggests a counter-trend function, indicating a phase of correction or temporary reversal, moving opposite to the primary trend.
Currently, the market is in an impulsive mode, with strong wave movements in the direction of the counter-trend, consisting of five waves. This reflects a robust push against the main trend.
The structure identified is orange wave 5, the final wave in a five-wave sequence, typically marking the last push in the counter-trend before a reversal or significant correction occurs.
Positioned as navy blue wave 5 of C, the market is in the fifth wave of a larger corrective wave C, which concludes an ABC corrective pattern following a five-three-five structure.
The next lower degree direction is identified as orange wave 1 of a new bearish trend, indicating that after the current orange wave 5 completes, the market will start a new downward trend with orange wave 1.
Orange wave 4 of 5 is complete, suggesting the fourth wave has finished, and the market is in orange wave 5 of 5, which is expected to end soon, marking the conclusion of the counter-trend movement.
Summary:
The AUDJPY daily chart analysis shows the market in a counter-trend function with an impulsive mode. The current structure is orange wave 5, positioned as navy blue wave 5 of C. Following the completion of orange wave 5 of 5, the market is anticipated to move into orange wave 1 of a new bearish trend. Orange wave 4 of 5 is complete, and orange wave 5 of 5 is nearing its end.
TadingLounge Forex AUDJPY Elliott Wave Analysis 4H Chart
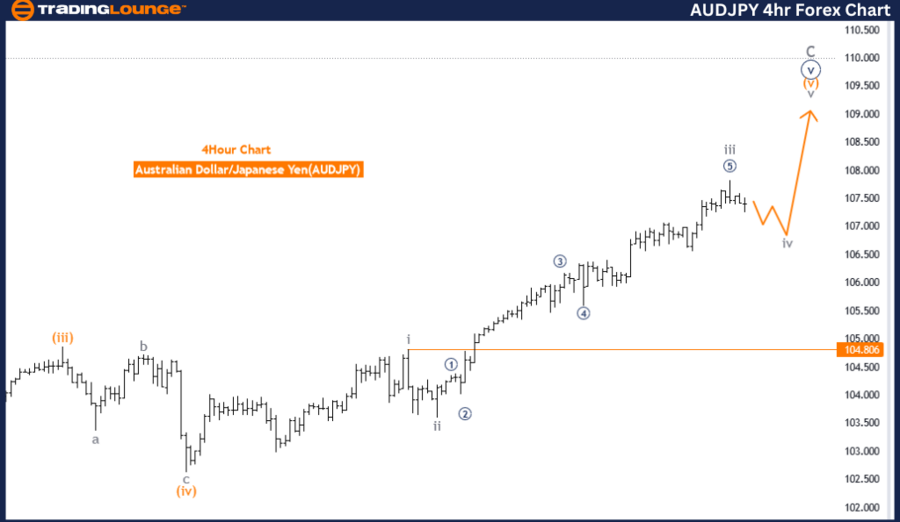
Australian Dollar / Japanese Yen (AUDJPY) 4-Hour Chart Analysis
AUDJPY Elliott Wave Technical Analysis
Function: Trend
Mode: Corrective
Structure: Gray Wave 4
Position: Orange Wave 5
Direction Next Higher Degrees: Gray Wave 5
Details:
The analysis identifies that gray wave 3 of 5 is complete, and gray wave 4 of 5 is currently in play. The wave cancel invalid level is set at 104.806.
The Elliott Wave analysis for the Australian Dollar / Japanese Yen (AUDJPY) on the 4-hour chart suggests a trending market, with price movements following a clear directional pattern.
Currently, the market mode is corrective, indicating a phase of consolidation or correction after a previous impulsive move. Corrective waves typically move against the main trend and are often more complex.
The structure identified is gray wave 4, representing the fourth corrective wave of a larger five-wave sequence, moving against the established trend and indicating a period of consolidation or retracement.
Positioned as orange wave 5, the market is preparing to enter or is already in the final wave of the larger sequence. Orange wave 5 follows the completion of gray wave 4, marking a final push in the main trend's direction before a larger correction or reversal.
The next higher degree direction is identified as gray wave 5, indicating that after gray wave 4 completes, the market will move into gray wave 5, likely an impulsive move in the primary trend's direction.
Gray wave 3 of 5 is complete, suggesting the third wave has finished, and the market is now in gray wave 4 of 5, a corrective phase indicating potential consolidation or retracement before the final wave (gray wave 5) begins.
The wave cancel invalid level is crucial for validating the current wave structure. If the market moves below 104.806, the current wave count would be invalidated, necessitating a reevaluation of the wave analysis.
Technical Analyst: Malik Awais
Source: visit Tradinglounge.com and learn From the Experts Join TradingLounge Here
Previous: GBPUSD Elliott Wave Technical Analysis
Special Trial Offer - 0.76 Cents a Day for 3 Months! Click here
Access 7 Analysts Over 170 Markets Covered. Chat Room With Support