Wheat Elliott Wave Analysis – TradingLounge

Function - Trend Mode 

Trend Structure - Diagonal for Wave V

Position - Wave C of V

Direction - Wave C of V is Still in Play

Wheat futures have continued their upward trend since May 13, 2025, and prices may soon reach a critical resistance zone. This could potentially trigger a fresh wave of selling pressure. The longer-term downtrend that began in March 2022 appears incomplete, implying further bearish potential for wheat in the near future.

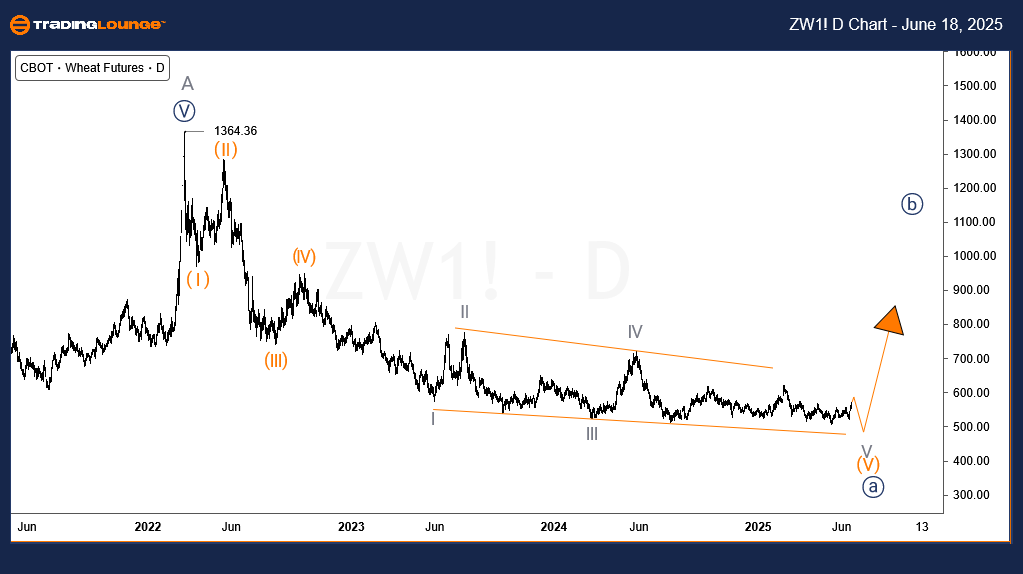
Wheat Daily Chart Analysis

Wheat is approaching the terminal stage of a long-running bearish impulse wave that originated in March 2022. The fifth wave of this structure has taken considerably more time to form than the earlier waves. Nonetheless, the wave count remains unfinished. Since October 2022, wave (V) has been developing as an ending diagonal — a typical pattern that precedes a major trend reversal. This implies a multi-month or possibly multi-year bullish correction could follow after one more downward movement.

Wheat-d-commodity-ch...


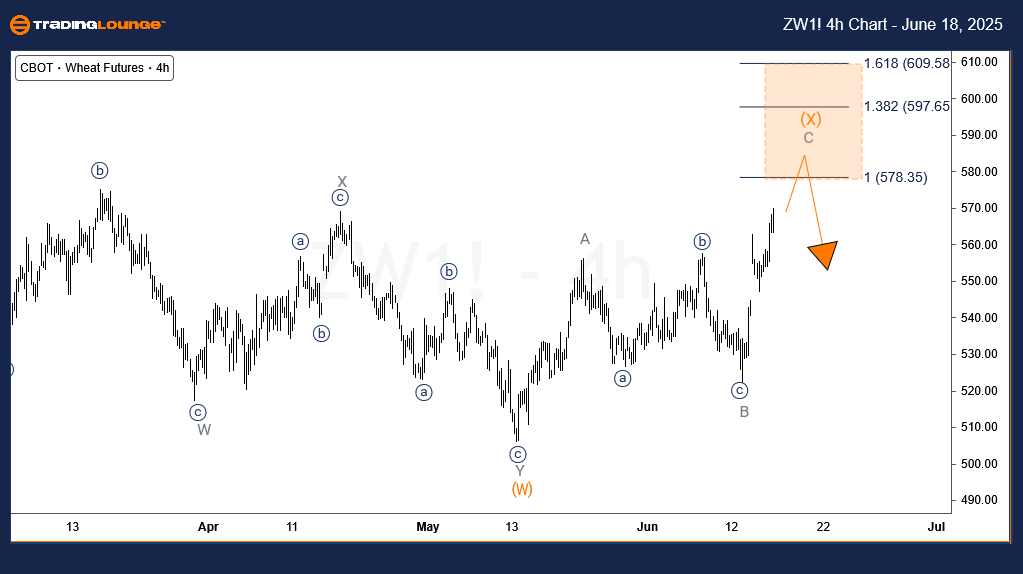
Wheat H4 Chart Analysis

The 4-hour timeframe shows that sub-wave ((B)) of wave V of (V) concluded at 621 in February 2025. This initiated wave ((C)), with sub-wave (W) of ((C)) finishing on May 13, 2025. The ongoing upward leg is wave (X) of ((C)), which is projected to stay below 621.75. Resistance is expected between 609.58 and 578.35. If this resistance zone holds, wave (Y) to the downside could begin, targeting the $500 level or lower — a price range likely to reintroduce strong bearish momentum.

Technical Analyst: Sanmi Adeagbo

Source: Visit Tradinglounge.com and learn from the Experts. Join TradingLounge Here 

See Previous: Natural Gas Elliott Wave Technical Analysis

VALUE Offer - $1 for 2 Weeks then $29 a month!Click here

Access 7 Analysts Over 200 Markets Covered. Chat Room With Support

Wheat-4h-commodity-c...

Related

Swiss Market Elliott Wave Analysis Shows SMI Correction Phase Ending and Bullish Trend Forming on Daily and Weekly Charts

Swiss Market Elliott Wave Analysis Shows SMI Correction Phase Ending and Bullish Trend Forming on Daily and Weekly Charts

Elliott Wave analysis of the Swiss Market Index on both daily and weekly charts, highlighting curren...

Read More >
Discover How Newmont Corporation is Expected to Perform in the Upcoming Market Sessions: NEM Elliott Wave Analysis

Discover How Newmont Corporation is Expected to Perform in the Upcoming Market Sessions: NEM Elliott Wave Analysis

Our detailed Elliott Wave analysis of ASX Newmont Corporation (NEM) provides insights into the stock...

Read More >
Ethereum/ U.S. dollar(ETHUSD) Elliott Wave Technical Analysis 15 November 23

Ethereum/ U.S. dollar(ETHUSD) Elliott Wave Technical Analysis 15 November 23

Ethereum/ U.S. dollar(ETHUSD) Elliott Wave Technical Analysis on 15 November 23 with daily chart.

Read More >
Market Indices in Focus: Elliott Wave Analysis and Trade Strategy Amid S&P 500 Decline

Market Indices in Focus: Elliott Wave Analysis and Trade Strategy Amid S&P 500 Decline

The S&P 500 saw its biggest drop since August as U.S. manufacturing continued to contract for the fi...

Read More >
U.S.Dollar/Canadian Dollar(USD/CAD) Elliott Wave Technical Analysis 24 October 23

U.S.Dollar/Canadian Dollar(USD/CAD) Elliott Wave Technical Analysis 24 October 23

In summary, the USD/CAD Elliott Wave Analysis for 24 October 23, is significant for traders seeking ...

Read More >

$1 for 2 Weeks

then $29 a month!

What a Special Offer!

Trade Recommendations

Unleash the power of deversified trading with our comprehensive portfolio, covering 250+ markets:

  • Stock Trades
  • Crypto Trades
  • Forex Trades
  • Commodity Trades
Elliott Wave Analysis

Gain a competitive edge with expert insights and AI-powered Elliott Wave charting into:

  • Global Indices
  • US Stocks & ASX Stocks
  • Forex & Crypto
  • Commodities
Top-Notch Trading Tools

Equip yourself with the tools of success:

  • Real-time Chat rooms
  • Elliott Wave Algorithm
  • Portfolio tools
  • TradingLevels
  • Screener
  • Trading Game
7 Elliott Wave Analysts

Stay ahead of the market with daily charts and insightful videos
Your secret to strategic trading!

JOIN HERE


Welcome to TradingLounge (ASIC A.R.No. 321187), specialists in trades, trading education and technical analysis, covering stocks, indices, commodities, forex and cryptocurrencies.

When you join TradingLounge you have access to everything we offer, including trade tools, educational content and a social platform to chat with like-minded investors.

Read more

@Copyright 2024 by tradinglounge.com

Contact Us

Australian no: 02 4787 6020

International no: +61 (2) 47876020

Pay with:

Find us on