16Jun

Elliott Wave Natural Gas Forecast: Bullish $4.00–$4.47 Rally from $2.858 Low, Watch $4.70 Breakout Potential

Natural Gas Elliott Wave Forecast | Trading Lounge

Since late May, Natural Gas prices have experienced continued volatility. The upward trend initiated on April 24 is likely to push prices toward the early April range of $4.00 to $4.25 in the near term. As long as the price remains above the April 24 support at $2.858, the bias remains bullish.


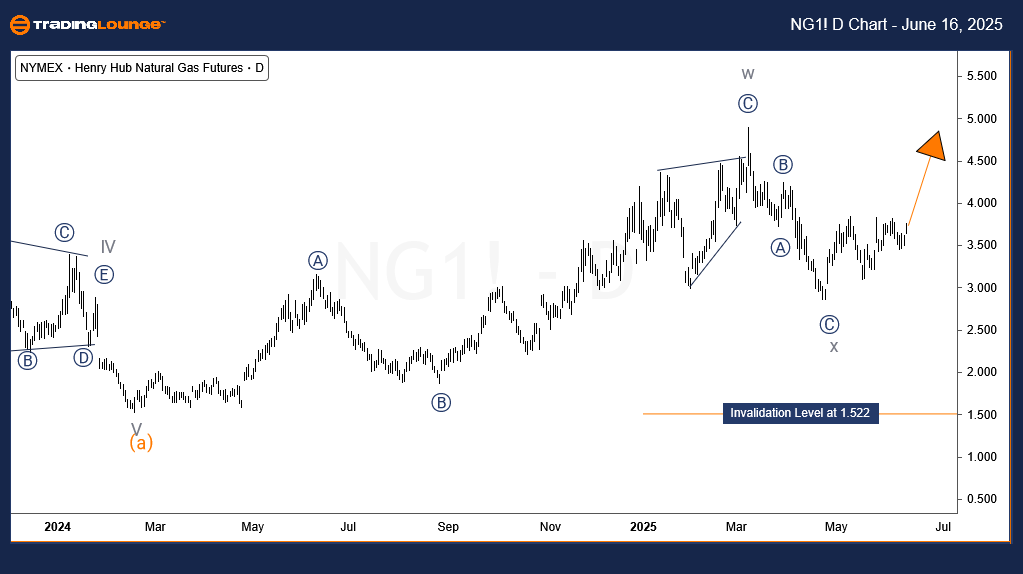
Natural Gas Daily Chart Forecast

Natural Gas completed a major bearish Elliott Wave impulse cycle from August 2022 to February 2024. According to Elliott Wave Theory, a 5-wave impulsive move is usually followed by a corrective 3-wave structure. This corrective phase began in February 2024.

The initial 3-wave rally from February 2024 peaked in March 2025, possibly concluding the correction. Traditionally, a subsequent 5-wave bearish sequence would resume the larger downtrend. However, the market instead formed another 3-wave drop, ending on April 24, 2025, which triggered a fresh upward move.

This development indicates the correction from February may still be in progress and could evolve into a complex double correction, potentially extending to $6.23. Currently, the rally from the April low has not confirmed whether it will form a full 5-wave impulse or another 3-wave corrective move, keeping both scenarios viable.

Over the short to medium term, a 3-wave rally from the April low is expected to unfold, targeting the $4.09 to $4.47 range.

Natural-Gas-d-commod...


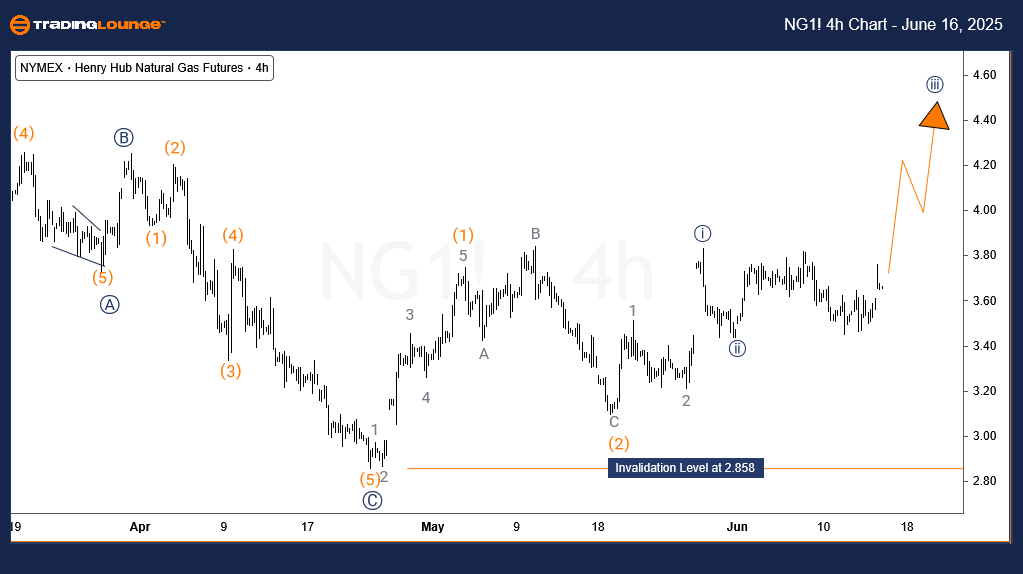
Natural Gas 4-Hour Chart Forecast

The 4-hour chart outlines the smaller wave patterns that have emerged since the April 2025 low. Two legs, labeled wave (1) and wave (2), have been completed, with wave (3) now in progress.

If this sequence represents part of a 5-wave bullish impulse, it could break above the $4.70 resistance level, indicating a double correction is forming from the February low. On the other hand, if the current rally concludes within the $4.09–$4.47 range, it could suggest a simple 3-wave correction, potentially leading to a continuation of the March 2025 downtrend.

Technical Analyst: Sanmi Adeagbo

Source: Visit Tradinglounge.com and learn from the Experts. Join TradingLounge Here 

See Previous: Cocoa Elliott Wave Technical Analysis

VALUE Offer - $1 for 2 Weeks then $29 a month!Click here

Access 7 Analysts Over 200 Markets Covered. Chat Room With Support

Natural-Gas-4h-commo...

Related

Mahindra & Mahindra Stock Elliott Wave Analysis Shows Bullish Trend and Strong Forecast with Wave 5 Now in Progress

Mahindra & Mahindra Stock Elliott Wave Analysis Shows Bullish Trend and Strong Forecast with Wave 5 Now in Progress

Elliott Wave analysis of Mahindra & Mahindra, highlighting a strong bullish trend supported by impul...

Read More >
Gold (XAUUSD) Commodity Ongoing Bullish Trend in the Market: In-Depth Elliott Wave Technical Analysis and Forecast

Gold (XAUUSD) Commodity Ongoing Bullish Trend in the Market: In-Depth Elliott Wave Technical Analysis and Forecast

In this detailed Gold Elliott Wave analysis, we explore the ongoing bullish trend in the gold market...

Read More >
Actionable Trading Strategies and Key Price Points: BHP GROUP LIMITED - BHP Stock Analysis & Elliott Wave Technical Forecast

Actionable Trading Strategies and Key Price Points: BHP GROUP LIMITED - BHP Stock Analysis & Elliott Wave Technical Forecast

This article provides an in-depth Elliott Wave Analysis of ASX: BHP GROUP LIMITED. We explore curren...

Read More >
Shanghai Composite Elliott Wave Analysis: Unlock Market Trends, Predict Future Moves & Maximize Your Trading Profits!

Shanghai Composite Elliott Wave Analysis: Unlock Market Trends, Predict Future Moves & Maximize Your Trading Profits!

This Shanghai Composite Elliott Wave Analysis provides a detailed outlook on the current stock marke...

Read More >
Master Soybean Commodity Trends: Elliott Wave Technical Analysis for Precise Futures Market with Actionable Insights

Master Soybean Commodity Trends: Elliott Wave Technical Analysis for Precise Futures Market with Actionable Insights

Get a comprehensive view of soybean market trends with our detailed Elliott Wave analysis. Learn abo...

Read More >
MAHINDRA & MAHINDRA Elliott Wave Analysis: Navy Blue Wave 3 & Gray Wave 5 Progression Above Key Level 2427

MAHINDRA & MAHINDRA Elliott Wave Analysis: Navy Blue Wave 3 & Gray Wave 5 Progression Above Key Level 2427

Elliott Wave analysis of Mahindra & Mahindra, both daily and weekly charts confirm a bullish impulsi...

Read More >

$1 for 2 Weeks

then $29 a month!

What a Special Offer!

Trade Recommendations

Unleash the power of deversified trading with our comprehensive portfolio, covering 250+ markets:

  • Stock Trades
  • Crypto Trades
  • Forex Trades
  • Commodity Trades
Elliott Wave Analysis

Gain a competitive edge with expert insights and AI-powered Elliott Wave charting into:

  • Global Indices
  • US Stocks & ASX Stocks
  • Forex & Crypto
  • Commodities
Top-Notch Trading Tools

Equip yourself with the tools of success:

  • Real-time Chat rooms
  • Elliott Wave Algorithm
  • Portfolio tools
  • TradingLevels
  • Screener
  • Trading Game
7 Elliott Wave Analysts

Stay ahead of the market with daily charts and insightful videos
Your secret to strategic trading!

JOIN HERE


Welcome to TradingLounge (ASIC A.R.No. 321187), specialists in trades, trading education and technical analysis, covering stocks, indices, commodities, forex and cryptocurrencies.

When you join TradingLounge you have access to everything we offer, including trade tools, educational content and a social platform to chat with like-minded investors.

Read more

@Copyright 2024 by tradinglounge.com

Contact Us

Australian no: 02 4787 6020

International no: +61 (2) 47876020

Pay with:

Find us on