Cocoa Elliott Wave Forecast
Cocoa Elliott Wave Forecast – Daily Chart
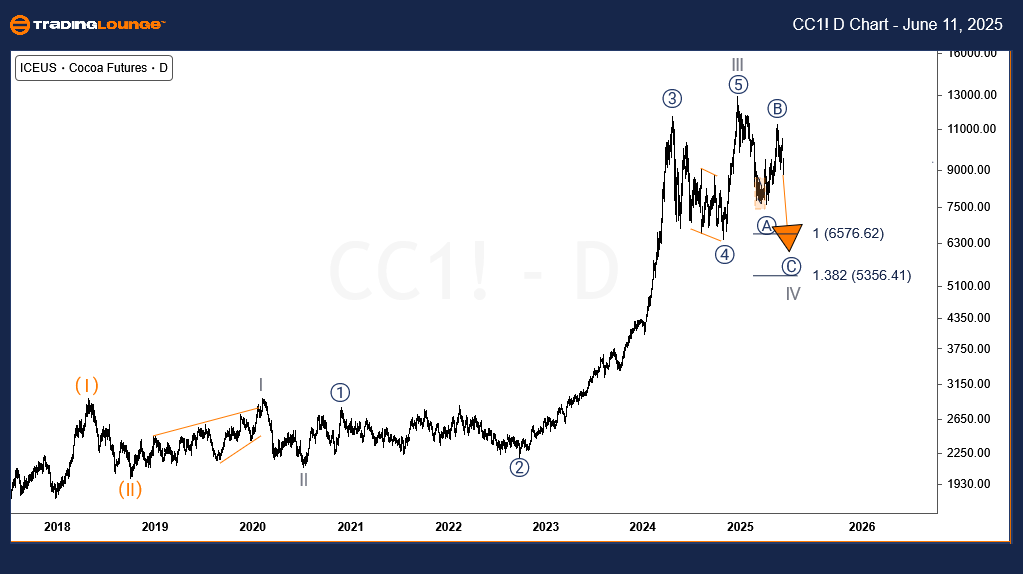
After testing a significant resistance zone, Cocoa futures prices are once again moving lower, continuing the bearish retracement that started on December 18, 2024. This current downward leg is expected to break below the April 2025 low, potentially reaching the 6576–5356 area. This move would deepen the ongoing correction.
Cocoa Long-Term Elliott Wave Forecast
The long-term trend in Cocoa prices remains bullish, driven by a broader uptrend that began in April 2017. The existing price structure reflects a key Elliott Wave advance, including:
- Wave (I) completed in April 2018
- Wave (II) ended in October 2018
- Wave (III) initiated in October 2018, rallying from $2,147 to a peak of $12,931 in December 2024
That December 2024 peak marks the end of Wave III of (III) and the start of a corrective Wave IV in the major impulse wave that began in July 2020.
Currently, Wave IV is unfolding through:
- Wave ((A)) concluded in March 2025
- Wave ((B)) finalized in May 2025
- Wave ((C)) is now active, targeting a decline toward the 6576–5356 region, equal to 100% of Wave ((A)) measured from ((B))
This implies continued short-term downside pressure within an otherwise bullish long-term commodity trend.

Cocoa Elliott Wave Forecast – 4H Chart
Zooming into the 4-hour time frame, the structure of Wave ((C)) reveals a clear downward trend. Thus far:
Waves (1) and (2) of ((C)) are complete
The market is currently forming Wave (3) of ((C)), with downside targets around 7773–7380 in the short term
This analysis supports a bearish short-term outlook for Cocoa, consistent with an ongoing Elliott Wave correction inside a larger upward trend.
Technical Analyst: Sanmi Adeagbo
Source: Visit Tradinglounge.com and learn from the Experts. Join TradingLounge Here
See Previous: Gold Elliott Wave Technical Analysis
VALUE Offer - Buy 1 Month & Get 3 Months!Click here
Access 7 Analysts Over 200 Markets Covered. Chat Room With Support
