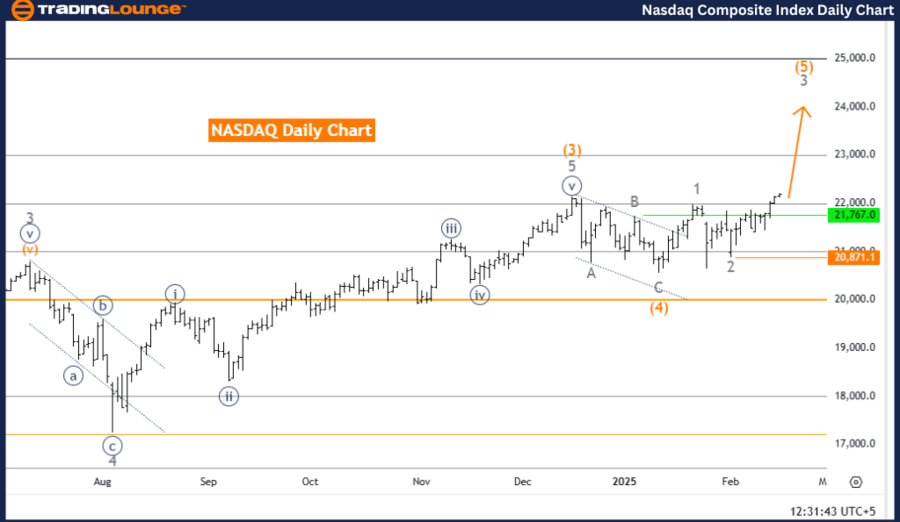
NASDAQ Elliott Wave Analysis – Trading Lounge Day Chart
NASDAQ Elliott Wave Technical Analysis
Function: Bullish Trend
Mode: Impulsive
Structure: Gray Wave 3
Position: Orange Wave 5
Next Higher Degree Direction: Gray Wave 3 (Started)
Wave Cancel Invalid Level: 20,871.1
Market Overview
The NASDAQ daily chart confirms a strong bullish trend, with the market currently in an impulsive mode. The wave structure places the index within Gray Wave 3, which is a part of the broader Orange Wave 5, indicating sustained upward momentum.
The completion of Gray Wave 2, which acted as a corrective phase, has set the stage for Gray Wave 3, suggesting a continuation of the upward movement. With bullish momentum building, traders can expect further price appreciation in the near term.
Key Level to Monitor
A critical support level to watch is the wave cancel invalidation level at 20,871.1. If the price drops below this threshold, the current wave count would be invalidated, possibly altering the bullish outlook. Traders should closely track this level to confirm the continuation of the bullish trend.
Conclusion
The NASDAQ daily Elliott Wave analysis suggests a strong bullish phase, with the market currently in Gray Wave 3 of Orange Wave 5. The completion of Gray Wave 2 has cleared the path for additional upward momentum, reinforcing positive market sentiment.
The 20,871.1 invalidation level remains a key threshold—a breach below this point could indicate a trend reversal. However, as long as Gray Wave 3 remains active, the uptrend is likely to continue, offering traders and investors a clear market structure to monitor.
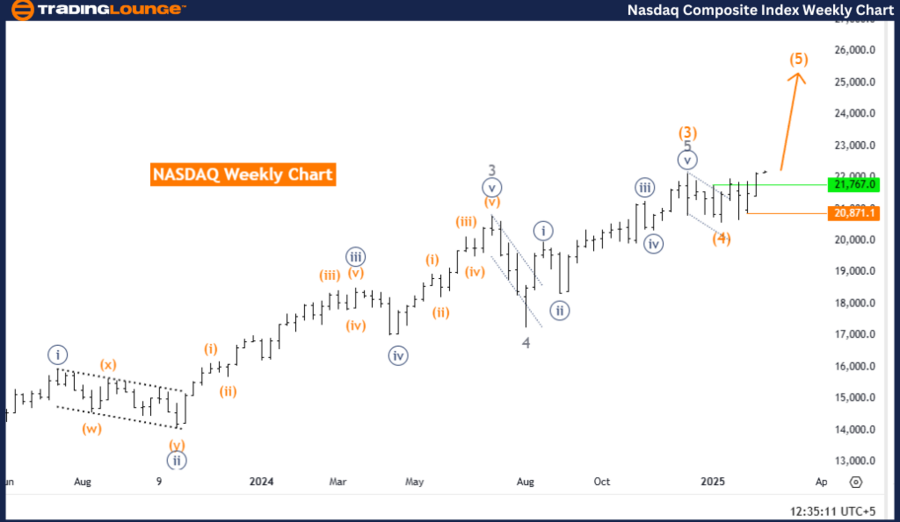
NASDAQ Elliott Wave Analysis – Trading Lounge Weekly Chart
NASDAQ Elliott Wave Technical Analysis
Function: Bullish Trend
Mode: Impulsive
Structure: Orange Wave 5
Next Higher Degree Direction: Gray Wave 3 (Started)
Wave Cancel Invalid Level: 20,871.1
Market Overview
The NASDAQ weekly chart reinforces a bullish Elliott Wave structure, with the index currently progressing through Orange Wave 5. This impulsive wave suggests continued upside potential, aligning with the overall market strength.
The completion of Orange Wave 4 has confirmed the transition into Orange Wave 5, maintaining the bullish trend. This indicates that the NASDAQ index is in a strong growth phase, with further price increases expected.
Next Wave Projection
The next higher-degree wave, Gray Wave 3, has already started, suggesting the market remains in a larger uptrend. This further strengthens the bullish outlook, with expectations of sustained gains.
Conclusion
The NASDAQ weekly Elliott Wave analysis presents a strong bullish trend, with Orange Wave 5 actively developing. The transition from Orange Wave 4 to Orange Wave 5 suggests a continuation of the rally, with higher prices anticipated.
As long as the wave structure remains intact, the bullish trend should persist. However, traders must monitor the 20,871.1 wave cancel invalidation level, as a break below this point could invalidate the current Elliott Wave count, potentially leading to a trend reversal.
For optimal trading decisions, traders should track price action closely while aligning with Elliott Wave projections to anticipate potential market shifts and opportunities.
Technical Analyst: Malik Awais
Source: visit Tradinglounge.com and learn From the Experts Join TradingLounge Here
Previous: FTSE 100 (UK) Elliott Wave Technical Analysis
VALUE Offer - Buy 1 Month & Get 3 Months!Click here
Access 7 Analysts Over 200 Markets Covered. Chat Room With Support