21Feb

JAMES HARDIE INDUSTRIES PLC (JHX) Elliott Wave Analysis: ASX JHX Stock Forecast, Market Trends and Trading Strategy for Investors

Elliott Wave Analysis: ASX JAMES HARDIE INDUSTRIES PLC (JHX) - Market Outlook

Greetings,

Our Elliott Wave technical analysis provides an updated forecast for JAMES HARDIE INDUSTRIES PLC (ASX: JHX). Based on our evaluation, JHX stock is likely to extend its decline in the medium-term, suggesting that traders should exercise caution with long positions due to prevailing risk factors. This analysis outlines key price levels and market trends, helping traders assess the technical outlook using both quantitative and pattern-based strategies.


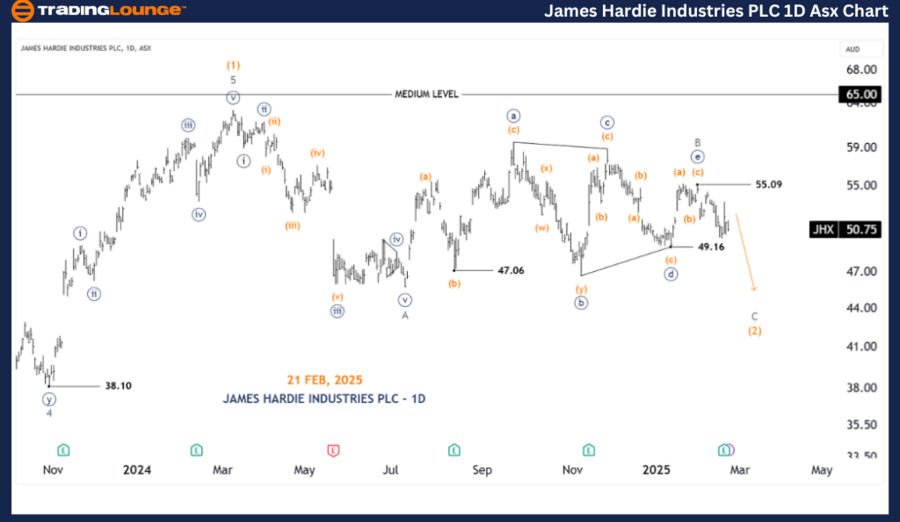
JAMES HARDIE INDUSTRIES PLC (JHX) Elliott Wave Technical Analysis 1D Chart (Semilog Scale)

Function: Major Trend (Intermediate Degree, Orange)

Mode: Motive

Structure: Impulse

Position: Wave C - Grey of Wave (2) - Orange

Technical Breakdown:

Wave (2) - Orange remains incomplete, forming a classic Zigzag pattern.
✔ The recent sideways movement has shaped a Triangle labeled Wave B - Grey, which has now concluded.
Wave C - Grey is expected to decline further, with a likely break below 49.16 USD, confirming a bearish structure.
Invalidation Level: If the price surpasses 55.09 USD, this bearish scenario will be negated.

🔹 Key Price Level: 49.16 USD

JAMES-HARDIE-INDUSTR...


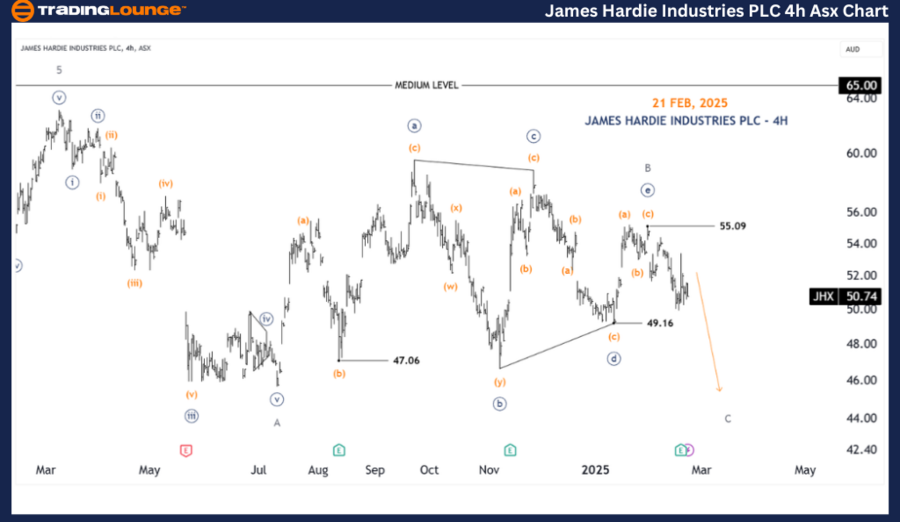
JAMES HARDIE INDUSTRIES PLC (JHX) 4-Hour Chart Analysis

Function: Major Trend (Intermediate Degree, Orange)

Mode: Motive

Structure: Impulse

Position: Wave C - Grey of Wave (2) - Orange

Technical Breakdown:

✔ A detailed wave analysis indicates that Wave ((e)) - Navy of Wave B - Grey has formed a three-wave Zigzag, concluding at 55.09 USD.
✔ With this corrective structure completed, the bearish outlook remains dominant, suggesting continued downside potential.
Invalidation Level: If the price rises above 55.09 USD, this bearish forecast will be reconsidered.

🔹 Key Price Level: 49.16 USD

Technical Analyst: Hua (Shane) Cuong, CEWA-M (Master’s Designation).

Source: visit Tradinglounge.com and learn From the Experts Join TradingLounge Here 

See Previous: RIO TINTO LIMITED Elliott Wave Technical Analysis

VALUE Offer - Buy 1 Month & Get 3 Months!Click here

Access 7 Analysts Over 200 Markets Covered. Chat Room With Support

JAMES-HARDIE-INDUSTR...


Conclusion: JAMES HARDIE INDUSTRIES PLC (JHX) Elliott Wave Forecast

Our Elliott Wave forecast for JHX stock provides a comprehensive market outlook, equipping traders with key technical insights. By identifying validation and invalidation price levels, we enhance confidence in our wave count predictions. This structured technical analysis offers a professional and data-driven approach to predicting JHX price movements, assisting traders in making well-informed decisions.

Related

S&P/TSX 60 Index Elliott Wave Analysis: Market Trends, Forecast, Market Movements with this Comprehensive Technical Analysis

S&P/TSX 60 Index Elliott Wave Analysis: Market Trends, Forecast, Market Movements with this Comprehensive Technical Analysis

This analysis provides a detailed Elliott Wave forecast for the S&P/TSX 60 index, covering the lates...

Read More >
BTCUSD Elliott Wave Technical Analysis to Understand Bitcoin’s Current Price Action and BTC Forecast News Today

BTCUSD Elliott Wave Technical Analysis to Understand Bitcoin’s Current Price Action and BTC Forecast News Today

Dive into an in-depth BTCUSD Elliott Wave analysis to understand Bitcoin’s current price action and...

Read More >
Risk Management Strategies for Australian Dollar/U.S. Dollar: AUD/USD Forex Elliott Wave Technical Analysis

Risk Management Strategies for Australian Dollar/U.S. Dollar: AUD/USD Forex Elliott Wave Technical Analysis

Discover the latest AUD/USD Elliott Wave analysis focusing on day and 4-hour chart insights. Learn a...

Read More >
Reliance Industries Stocks Elliott Wave Technical Analysis: Insights into Daily and 4-Hour Charts and Long-Term Market Outlook

Reliance Industries Stocks Elliott Wave Technical Analysis: Insights into Daily and 4-Hour Charts and Long-Term Market Outlook

This article provides a Technical analysis of Reliance Industries using the Elliott Wave theory. It ...

Read More >

Buy 1 Month

Get 3 Months!

Special Offer:

Trade Recommendations

Unleash the power of deversified trading with our comprehensive portfolio, covering:

  • Stock Trades
  • Crypto Trades
  • Forex Trades
  • Commodity Trades
Elliott Wave Analysis

Gain a competive edge with expert insights in to:

  • Global Indices
  • US Stocks & ASX Stocks
  • Forex & Crypto
  • Commodities
Top-Notch Trading Tools

Equip yourself with the tools of success:

  • Social Chat
  • Elliott Wave Algorithm
  • Screener
  • TradingLevels
  • Trading Game
7 Elliott Wave Analysts

Stay ahead of the market with daily charts and insightful videos
-Your secret to strategic trading!

JOIN HERE


Welcome to TradingLounge (ASIC A.R.No. 321187), specialists in trades, trading education and technical analysis, covering stocks, indices, commodities, forex and cryptocurrencies.

When you join TradingLounge you have access to everything we offer, including trade tools, educational content and a social platform to chat with like-minded investors.

Read more

@Copyright 2024 by tradinglounge.com

Contact Us

Australian no: 02 4787 6020

International no: +61 (2) 47876020

Pay with:

Find us on