Silver Elliott Wave Analysis: Bullish Outlook Amid August Volatility

Silver has shown a mixed performance throughout August. The commodity initially dropped nearly 3% during the first week but quickly rebounded, gaining over $3.2 from a low just above $26.5. As the month progresses, Silver has managed a modest net gain, setting up potential rallies as we approach September.

Silver Elliott Wave Technical Analysis

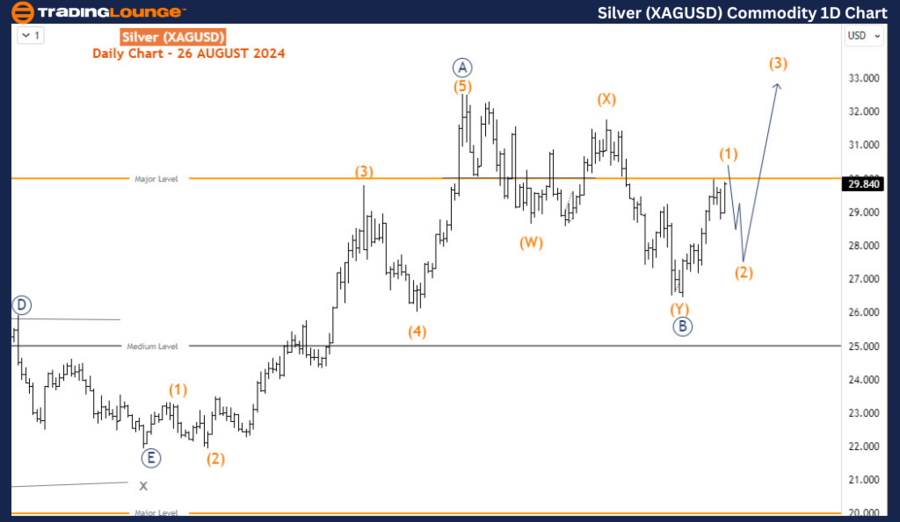
Silver Daily Chart Analysis

The daily chart indicates that Silver completed an impulsive wave sequence, labeled as wave A (circled), which started in January 2024 and ended in May 2024. This upward move was followed by a corrective pullback, labeled as wave B (circled), marking a temporary pause in the broader bullish trend. The wave B (circled) pullback seems to have taken the form of a double zigzag pattern, which suggests that the correction is nearing its conclusion.

With the completion of wave B (circled), the market is now likely entering wave C (circled), which is expected to be an impulse wave similar to wave A (circled). This wave C (circled) could drive prices above the $36 level. The initial leg of this upward movement, labeled wave (1), is currently in its final stages and is expected to complete around the $30 mark.

Silver-XAGUSD-Commod...

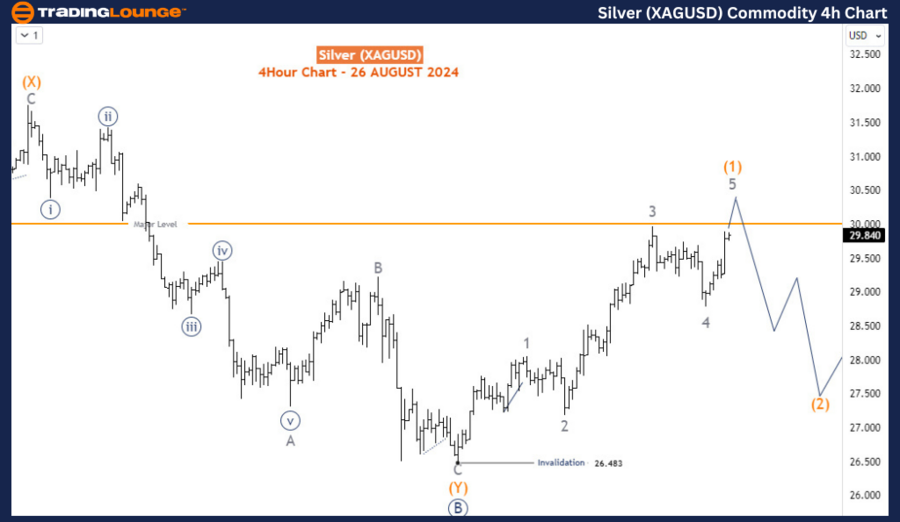
Silver H4 Chart Analysis

The 4-hour chart provides a closer look at the current wave structure. Wave (1) is unfolding as an impulse wave, with the market now advancing in wave 5 of (1). This wave 5 could push prices above the $30 threshold, potentially reaching as high as $30.5. However, traders should be aware that a corrective pullback in wave (2) is likely to follow once wave (1) concludes.

Despite the anticipated short-term corrections, the overall outlook for Silver remains bullish, with the price favoring a move toward $36 in the longer term. Along the way, two significant pullbacks are expected, offering traders opportunities to buy the dips after confirming the end of each correction.

Technical Analyst: Sanmi Adeagbo

Source: visit Tradinglounge.com and learn From the Experts Join TradingLounge Here 

See Previous: Gold Elliott Wave Technical Analysis

Special Trial Offer - 0.76 Cents a Day for 3 Months! Click here

Access 7 Analysts Over 200 Markets Covered. Chat Room With Support

Silver-XAGUSD-Commod...

In summary, while Silver may see some volatility and corrective moves in the near term, the broader trend remains upward. Traders should stay alert for potential entry points during the expected pullbacks, as the commodity remains well-positioned for a continued rally toward higher levels.

Related

ASX LIMITED Elliott Wave Analysis: Technical Forecast and Price Target Insights for Optimizing Your ASX Investment Strategy

ASX LIMITED Elliott Wave Analysis: Technical Forecast and Price Target Insights for Optimizing Your ASX Investment Strategy

This article provides a detailed Elliott Wave analysis of ASX LIMITED, offering insights into market...

Read More >
Decline in wheat prices: understand the current market trends with Wheat Commodity Elliott Wave Technical Analysis

Decline in wheat prices: understand the current market trends with Wheat Commodity Elliott Wave Technical Analysis

Explore our comprehensive Wheat Elliott Wave Analysis to understand the current price forecast and m...

Read More >
Cocoa Commodity Elliott Wave Technical Analysis: Market Trends, and Trading Insights for Wave B and Wave C Forecasts

Cocoa Commodity Elliott Wave Technical Analysis: Market Trends, and Trading Insights for Wave B and Wave C Forecasts

Gain valuable insights into cocoa price movements with Elliott Wave analysis. Explore the projected ...

Read More >
Commodity Market Elliott Wave Analysis: Bitcoin, Dollar, Gold, Silver, and Crude Oil Insights

Commodity Market Elliott Wave Analysis: Bitcoin, Dollar, Gold, Silver, and Crude Oil Insights

Explore the latest Elliott Wave analysis update for commodity markets, covering Bitcoin, DXY, Gold, ...

Read More >
Grasim Industries Elliott Wave Forecast: Chart Analysis Shows Bullish Momentum and Strong Upside in Indian Stock Market

Grasim Industries Elliott Wave Forecast: Chart Analysis Shows Bullish Momentum and Strong Upside in Indian Stock Market

Grasim Industries shows a bullish Elliott Wave pattern on both daily and weekly charts, forecasting ...

Read More >
GBPUSD Elliott Wave Analysis: Forex Pair Bullish Trend, Key Levels & Expert Technical Analysis and Trend Forecasts for Traders

GBPUSD Elliott Wave Analysis: Forex Pair Bullish Trend, Key Levels & Expert Technical Analysis and Trend Forecasts for Traders

GBPUSD is in a bullish trend, currently forming an impulsive wave in the Elliott Wave structure. Key...

Read More >

$1 for 2 Weeks

then $29 a month!

What a Special Offer!

Trade Recommendations

Unleash the power of deversified trading with our comprehensive portfolio, covering 250+ markets:

  • Stock Trades
  • Crypto Trades
  • Forex Trades
  • Commodity Trades
Elliott Wave Analysis

Gain a competitive edge with expert insights and AI-powered Elliott Wave charting into:

  • Global Indices
  • US Stocks & ASX Stocks
  • Forex & Crypto
  • Commodities
Top-Notch Trading Tools

Equip yourself with the tools of success:

  • Real-time Chat rooms
  • Elliott Wave Algorithm
  • Portfolio tools
  • TradingLevels
  • Screener
  • Trading Game
7 Elliott Wave Analysts

Stay ahead of the market with daily charts and insightful videos
Your secret to strategic trading!

JOIN HERE


Welcome to TradingLounge (ASIC A.R.No. 321187), specialists in trades, trading education and technical analysis, covering stocks, indices, commodities, forex and cryptocurrencies.

When you join TradingLounge you have access to everything we offer, including trade tools, educational content and a social platform to chat with like-minded investors.

Read more

@Copyright 2024 by tradinglounge.com

Contact Us

Australian no: 02 4787 6020

International no: +61 (2) 47876020

Pay with:

Find us on