NEE Elliott Wave Analysis: NextEra Energy Inc. (NEE)
In this Elliott Wave analysis of NextEra Energy Inc. (NEE), we will delve into the stock’s current price action to identify potential trading opportunities. By analyzing both the daily and 1-hour charts, we aim to provide a comprehensive view of the stock's position within the Elliott Wave structure.
NEE Elliott Wave Analysis - Daily Chart
NextEra Energy Inc. (NEE) Daily Chart
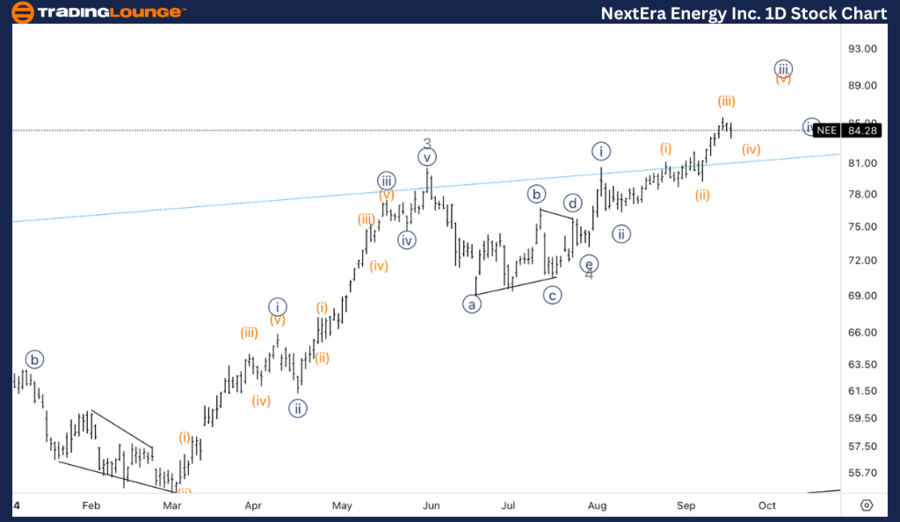
NEE Elliott Wave Technical Analysis
Function: Trend
Mode: Impulsive
Structure: Motive
Position: Wave 5 of (1)
Direction: Upside in Wave 5
Details: The analysis suggests an upside target as NEE moves into Wave 5 of (1), with the next significant level to watch being $100, coinciding with TradingLevel 100 (TL100). This wave appears to be part of a post-triangle thrust following Wave 4.
NEE Elliott Wave Technical Analysis - Daily Chart Breakdown
The daily chart analysis indicates that NextEra Energy is progressing through an impulsive trend, specifically Wave 5 of (1). This suggests that the stock may continue its upward trajectory within this final wave of the impulsive structure, potentially completing Wave (1).
A post-triangle thrust is identified, where Wave 5 follows a triangle pattern formed in Wave 4, often leading to sharp upward movements. The next target on the upside is $100, a critical psychological level that aligns with TradingLevel 100 (TL100). Traders should keep an eye on price action as it nears this level, watching for potential resistance or profit-taking opportunities.
NEE Elliott Wave Analysis - 1-Hour Chart
NextEra Energy Inc. (NEE) 1H Chart
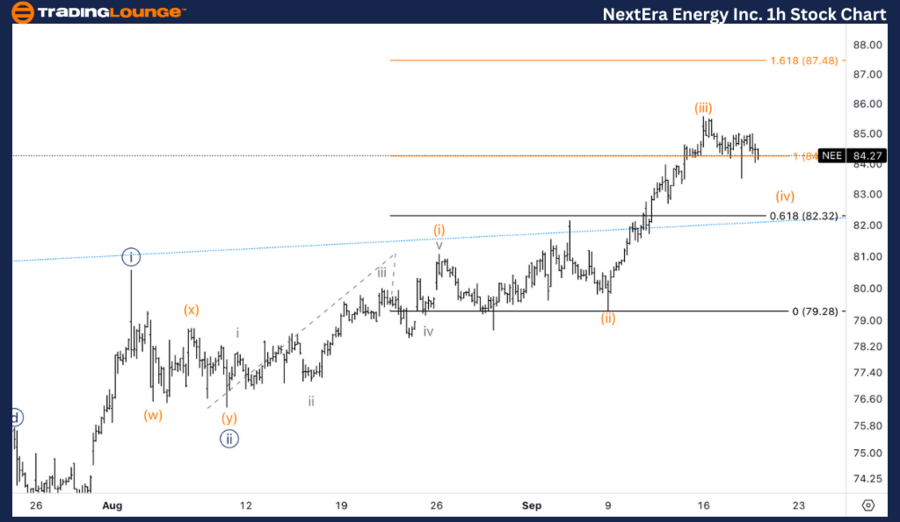
NEE Elliott Wave Technical Analysis
Function: Trend
Mode: Impulsive
Structure: Motive
Position: Wave (iv) of {iii}
Direction: Upside in Wave {iii}
Details: The stock appears to be either forming or concluding Wave (iv) of {iii}, with strong support found around the equality of Wave (iii) vs. (i). A potential move above $85 could confirm the resumption of the uptrend into Wave {iii}.
NEE Elliott Wave Technical Analysis - 1-Hour Chart Breakdown
On the 1-hour chart, NextEra Energy is currently in Wave (iv) of {iii}, suggesting a possible near completion of this corrective phase. The stock has found support near the equality level between Wave (iii) and Wave (i), a typical retracement point for Wave (iv). Once this correction completes, the next move higher into Wave (v) of {iii} is expected, continuing the bullish trend.
A critical level to watch is $85. If the stock breaks above this price, it would signal the end of the corrective phase and confirm the start of the next impulsive wave upward, targeting further gains in Wave {iii}. Traders should monitor this level closely for confirmation of bullish momentum.
Technical Analyst: Alessio Barretta
Source: visit Tradinglounge.com and learn From the Experts Join TradingLounge Here
See Previous: AbbVie Inc. (ABBV) Elliott Wave Technical Analysis
VALUE Offer - Buy 1 Month & Get 3 Months!Click here
Access 7 Analysts Over 200 Markets Covered. Chat Room With Support