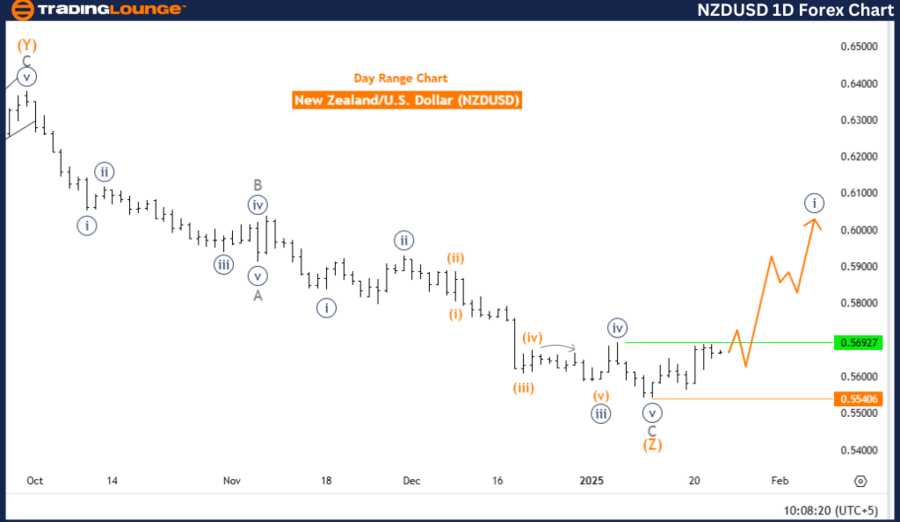
New Zealand Dollar/ U.S. Dollar (NZDUSD) Elliott Wave Analysis – Trading Lounge Day Chart
NZDUSD Elliott Wave Technical Overview
Function: Bullish Trend
Mode: Impulsive
Structure: Navy blue wave 1
Position: Gray wave 1
Direction Next Lower Degrees: Navy blue wave 2
Key Level (Invalidation): 0.55406
The daily NZDUSD Elliott Wave analysis indicates a bullish trend in an impulsive mode, with navy blue wave 1 actively developing as part of the broader gray wave 1 structure. This signals the early formation of an upward movement in the currency pair.
At present, the active navy blue wave 1 showcases strong bullish momentum, reinforcing the positive outlook. The anticipated next move is navy blue wave 2, which is expected to introduce a corrective phase before the bullish momentum resumes.
The crucial invalidation level for this wave setup is established at 0.55406, serving as an essential reference point. A price movement below this level would invalidate the current wave structure, prompting a review of the bullish scenario.
Conclusion
The daily analysis of NZDUSD presents a positive outlook, with navy blue wave 1 confirming upward momentum within gray wave 1. The formation of navy blue wave 2 will offer traders opportunities to monitor potential corrections before the trend progresses further.
The invalidation level acts as a significant tool for risk management, ensuring adherence to the Elliott Wave principles. This structured analysis empowers traders to make well-informed trading decisions in alignment with the prevailing market trend.
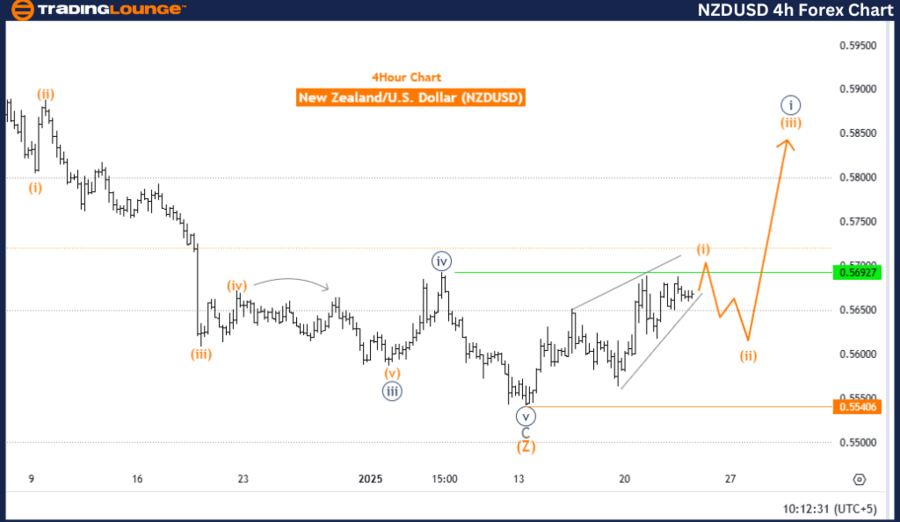
New Zealand Dollar/ U.S. Dollar (NZDUSD) Elliott Wave Analysis – Trading Lounge 4-Hour Chart
NZDUSD Elliott Wave Technical Overview
Function: Bullish Trend
Mode: Impulsive
Structure: Orange wave 1
Position: Navy blue wave 1
Direction Next Lower Degrees: Orange wave 2
Key Level (Invalidation): 0.55406
The four-hour Elliott Wave analysis for NZDUSD highlights a bullish trend, with an impulsive market mode. The current focus is on the development of orange wave 1, which is part of the broader navy blue wave 1, marking the beginning of a new upward movement.
The active orange wave 1 indicates strong momentum within navy blue wave 1, highlighting the initial phase of the bullish trend. Once orange wave 1 completes, the expected formation of orange wave 2 will serve as a corrective phase within the larger bullish pattern.
The wave structure’s invalidation level is set at 0.55406, acting as a vital checkpoint for validating the ongoing trend. A breach of this level would invalidate the bullish wave count, necessitating a reassessment of market positioning.
Conclusion
The four-hour NZDUSD analysis outlines a bullish perspective, driven by the continuation of orange wave 1 within navy blue wave 1. The development of orange wave 2 will offer potential opportunities for traders to observe corrective movements before further trend expansion.
The invalidation level is a critical component of risk management, ensuring compliance with Elliott Wave principles. This analysis delivers actionable insights into the early stages of the bullish trend, equipping traders with the necessary framework for strategic trading decisions.
Technical Analyst: Malik Awais
Source: visit Tradinglounge.com and learn From the Experts Join TradingLounge Here
Previous: EURUSD Elliott Wave Technical Analysis
VALUE Offer - Buy 1 Month & Get 3 Months!Click here
Access 7 Analysts Over 200 Markets Covered. Chat Room With Support