Visa Inc. (V) Elliott Wave Analysis: Comprehensive Market Position and Future Movements
Visa Inc. V Elliott Wave Analysis: Daily Chart Overview
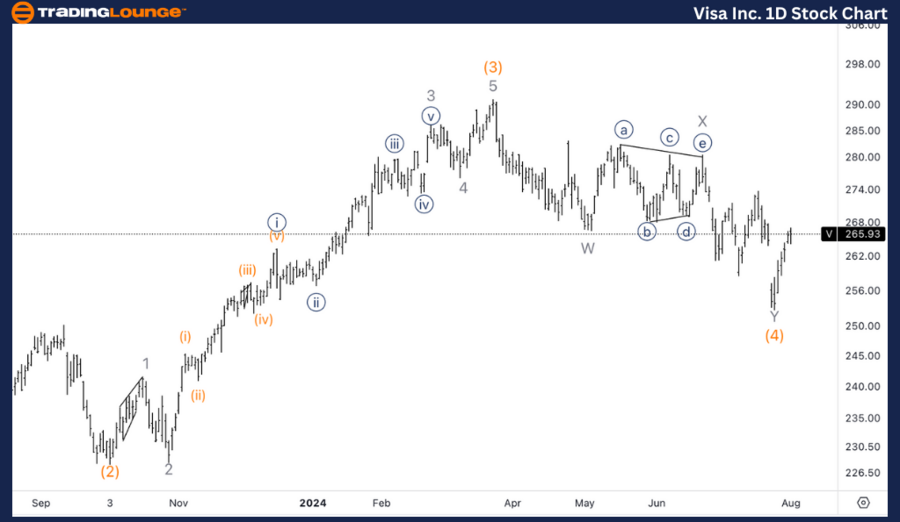
Visa Inc. (V) Daily Chart Analysis
V Elliott Wave Technical Analysis
Function: Trend
Mode: Impulsive
Structure: Motive
Position: Wave 1
Direction: Upside in wave 1 of (5)
Details: Seeking a bottom in wave (4), resuming higher into wave (5). A break and retest of $280 would provide additional confirmation.
V Stock Technical Analysis – Daily Chart
The analysis suggests that Visa has likely found a bottom in wave (4), and the price is now resuming its upward movement into wave (5). Breaking and retesting the $280 level would confirm this upward trajectory. This level is essential as it signifies the transition from wave (4) to wave (5), marking the beginning of the next impulsive phase.

Visa Inc. (V) Elliott Wave Analysis: 1-Hour Chart, August
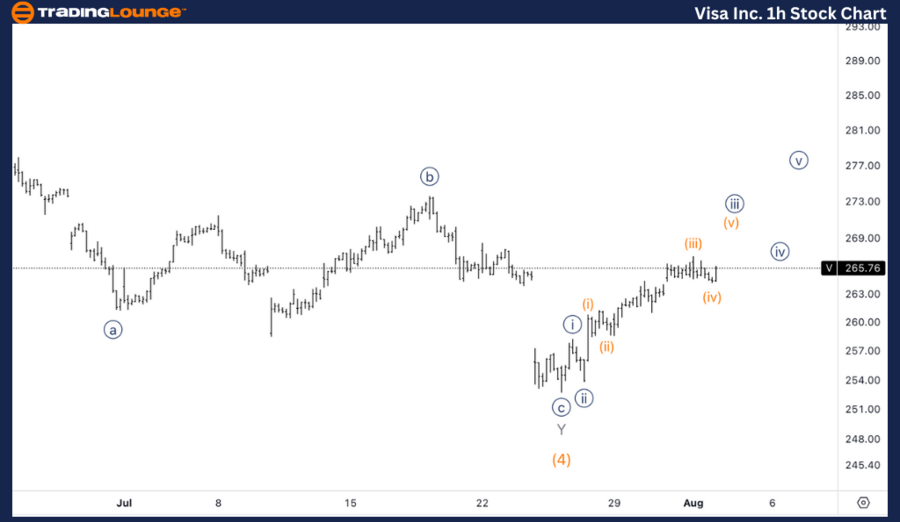
Visa Inc. (V) 1H Chart Analysis
V Elliott Wave Technical Analysis
Function: Trend
Mode: Impulsive
Structure: Motive
Position: Wave {iii} of 1
Direction: Upside in wave 1
Details: Expecting further upside within wave 1 as shown in the hourly chart. All minor pullbacks appear to be clear three-wave corrective moves, indicating additional upside potential.
V Elliott Wave Technical Analysis – 1H Chart
The shorter time frame analysis reveals that Visa is progressing within wave {iii} of 1. The hourly chart indicates that all minor pullbacks are clear three-wave corrective moves, typical within an impulsive wave structure. This pattern suggests further upside is anticipated as wave {iii} continues to unfold.
Technical Analyst: Alessio Barretta
Source: visit Tradinglounge.com and learn From the Experts Join TradingLounge Here
See Previous: NextEra Energy Inc. (NEE) Elliott Wave Technical Analysis
Special Trial Offer - 0.76 Cents a Day for 3 Months! Click here
Access 7 Analysts Over 170 Markets Covered. Chat Room With Support
