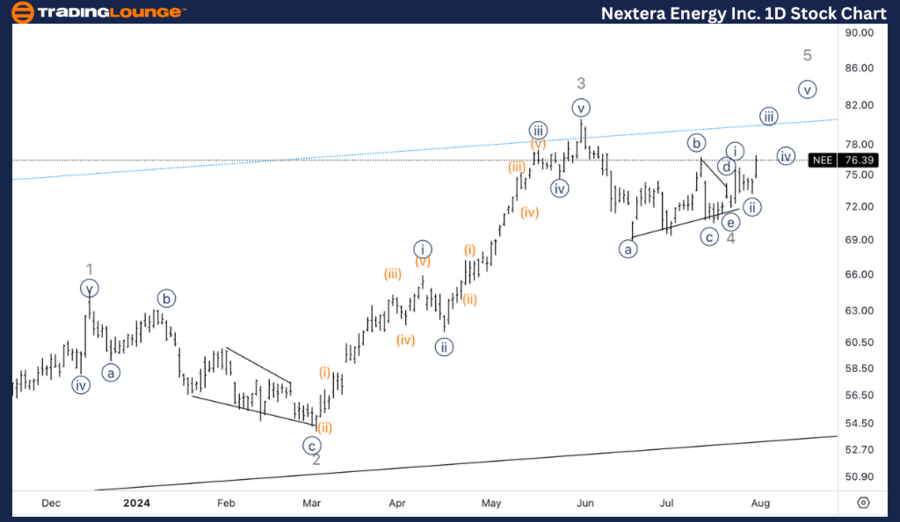
NextEra Energy Inc. (NEE) Elliott Wave Analysis - Daily Chart
NextEra Energy Inc. (NEE) Daily Chart Analysis
NEE Elliott Wave Technical Analysis
Function: Trend
Mode: Impulsive
Structure: Motive
Position: Minor wave 5
Direction: Upside in wave 5
Details: Anticipating continuation into wave 5, with potential sub-waves {i} and {ii} already in place. Monitoring for further upward movement within wave 5.
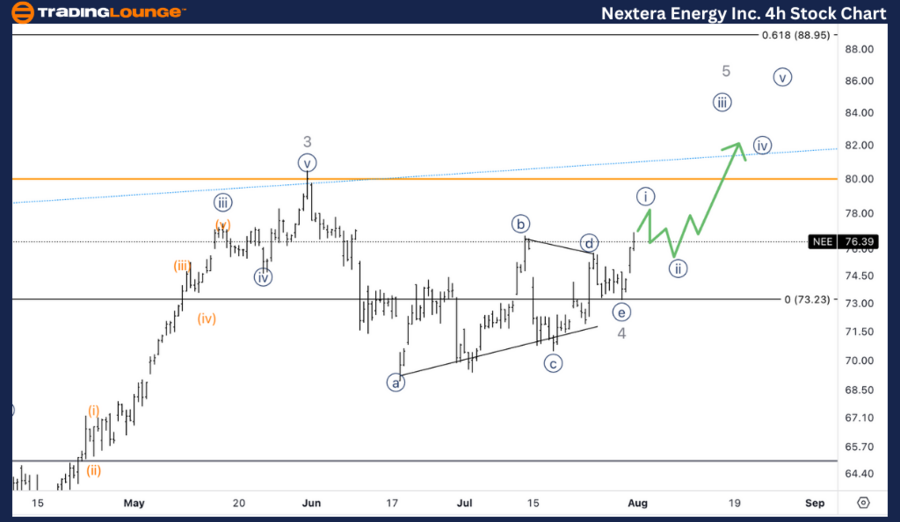
NextEra Energy Inc. (NEE) Elliott Wave Analysis - Trading Lounge 4H Chart
NextEra Energy Inc. (NEE) 4-Hour Chart Analysis
NEE Elliott Wave Technical Analysis
Function: Trend
Mode: Impulsive
Structure: Motive
Position: Minor wave 5
Direction: Upside in wave 5
Details: Considering the possibility of wave {i} of 5 being incomplete, suggesting potential higher upside targets. Observing 0.618 times wave 1 at around $88.
This Elliott Wave analysis for NextEra Energy Inc. (NEE) provides insights into both daily and 4-hour chart movements, highlighting key market positioning and potential future trends.
Technical Analyst: Alessio Barretta
Source: visit Tradinglounge.com and learn From the Experts Join TradingLounge Here
See Previous: MicroStrategy Inc. (MSTR) Elliott Wave Technical Analysis
Special Trial Offer - 0.76 Cents a Day for 3 Months! Click here
Access 7 Analysts Over 170 Markets Covered. Chat Room With Support